

5.4.2 Surface Water–Groundwater Exchanges
As no groundwater uptakes were integrated into the 1900s scenario, a comparison
between the 1900s and 2000s simulations clarifies the impact of groundwater
uptakes on stream–aquifer exchanges (Fig. 11), showing juxtaposed locations of
(1) portions of the hydrographic network for which the average stream–aquifer
direction flow switches from an exfiltration mode (i.e. aquifer feeding the river) to
an infiltration mode (i.e. aquifer being fed from the river) and (2) locations of the
current main pumping sites, thus identifying 179 km of rivers where stream-aquifer
exchanges are modified. At the scale of each river cell, additional simulations (not
shown) distinguished the origin of the stream reversal, either climatic (shown in
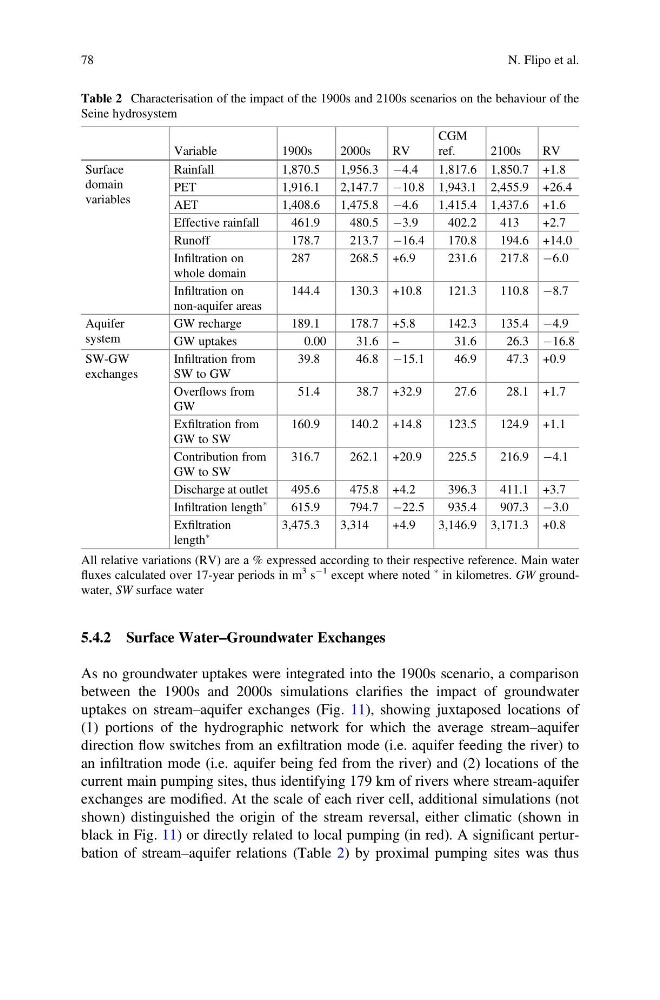
black in Fig. 11) or directly related to local pumping (in red). A significant perturbation of stream–aquifer relations (Table 2) by proximal pumping sites was thus
Table 2 Characterisation of the impact of the 1900s and 2100s scenarios on the behaviour of the
Seine hydrosystem
Variable
1900s
2000s
RV
CGM
ref.
2100s
RV
Surface
domain
variables
Rainfall
1,870.5
1,956.3 À4.4
1,817.6 1,850.7 +1.8
PET
1,916.1
2,147.7 À10.8 1,943.1 2,455.9 +26.4
AET
1,408.6
1,475.8 À4.6
1,415.4 1,437.6 +1.6
Effective rainfall
461.9
480.5 À3.9
402.2
413
+2.7
Runoff
178.7
213.7 À16.4
170.8
194.6 +14.0
Infiltration on
whole domain
287
268.5 +6.9
231.6
217.8 À6.0
Infiltration on
non-aquifer areas
144.4
130.3 +10.8
121.3
110.8 À8.7
Aquifer
system
GW recharge
189.1
178.7 +5.8
142.3
135.4 À4.9
GW uptakes
0.00
31.6 –
31.6
26.3 À16.8
SW-GW
exchanges
Infiltration from
SW to GW
39.8
46.8 À15.1
46.9
47.3 +0.9
Overflows from
GW
51.4
38.7 +32.9
27.6
28.1 +1.7
Exfiltration from
GW to SW
160.9
140.2 +14.8
123.5
124.9 +1.1
Contribution from
GW to SW
316.7
262.1 +20.9
225.5
216.9 À4.1
Discharge at outlet
495.6
475.8 +4.2
396.3
411.1 +3.7
Infiltration length
Ã
615.9
794.7 À22.5
935.4
907.3 À3.0
Exfiltration
length
Ã
3,475.3
3,314
+4.9
3,146.9 3,171.3 +0.8
All relative variations (RV) are a % expressed according to their respective reference. Main water
fluxes calculated over 17-year periods in m
3 s
À1 except where noted
à in kilometres. GW groundwater, SW surface water
78
N. Flipo et al.
As no groundwater uptakes were integrated into the 1900s scenario, a comparison
between the 1900s and 2000s simulations clarifies the impact of groundwater
uptakes on stream–aquifer exchanges (Fig. 11), showing juxtaposed locations of
(1) portions of the hydrographic network for which the average stream–aquifer
direction flow switches from an exfiltration mode (i.e. aquifer feeding the river) to
an infiltration mode (i.e. aquifer being fed from the river) and (2) locations of the
current main pumping sites, thus identifying 179 km of rivers where stream-aquifer
exchanges are modified. At the scale of each river cell, additional simulations (not
shown) distinguished the origin of the stream reversal, either climatic (shown in
black in Fig. 11) or directly related to local pumping (in red). A significant perturbation of stream–aquifer relations (Table 2) by proximal pumping sites was thus
Table 2 Characterisation of the impact of the 1900s and 2100s scenarios on the behaviour of the
Seine hydrosystem
Variable
1900s
2000s
RV
CGM
ref.
2100s
RV
Surface
domain
variables
Rainfall
1,870.5
1,956.3 À4.4
1,817.6 1,850.7 +1.8
PET
1,916.1
2,147.7 À10.8 1,943.1 2,455.9 +26.4
AET
1,408.6
1,475.8 À4.6
1,415.4 1,437.6 +1.6
Effective rainfall
461.9
480.5 À3.9
402.2
413
+2.7
Runoff
178.7
213.7 À16.4
170.8
194.6 +14.0
Infiltration on
whole domain
287
268.5 +6.9
231.6
217.8 À6.0
Infiltration on
non-aquifer areas
144.4
130.3 +10.8
121.3
110.8 À8.7
Aquifer
system
GW recharge
189.1
178.7 +5.8
142.3
135.4 À4.9
GW uptakes
0.00
31.6 –
31.6
26.3 À16.8
SW-GW
exchanges
Infiltration from
SW to GW
39.8
46.8 À15.1
46.9
47.3 +0.9
Overflows from
GW
51.4
38.7 +32.9
27.6
28.1 +1.7
Exfiltration from
GW to SW
160.9
140.2 +14.8
123.5
124.9 +1.1
Contribution from
GW to SW
316.7
262.1 +20.9
225.5
216.9 À4.1
Discharge at outlet
495.6
475.8 +4.2
396.3
411.1 +3.7
Infiltration length
Ã
615.9
794.7 À22.5
935.4
907.3 À3.0
Exfiltration
length
Ã
3,475.3
3,314
+4.9
3,146.9 3,171.3 +0.8
All relative variations (RV) are a % expressed according to their respective reference. Main water
fluxes calculated over 17-year periods in m
3 s
À1 except where noted
à in kilometres. GW groundwater, SW surface water
78
N. Flipo et al.