

decrease of infiltration of À6.0%, which is due to spatio-temporal variations in the
meteorological forcings (Fig. 9). To a lesser extent, a contrary observation could
have been formulated for the 1900s, which is the result of both climate forcings and
land use changes, particularly in the lower extent of the Paris urban area in the 1900s.
In this case, it is not possible to disentangle the two origins based solely on these
simulations.
Although the 2100s scenario is slightly drier in terms of recharge over the Seine
basin (Table 2), recharge variation is not homogeneous spatially (Fig. 10b, d).
Indeed, the lower Eocene and Palaeocene aquifer layers undergo a slight increase
of recharge, +3.0% and +8.7%, respectively. Negative variations are more pronounced further west over the Cenomanian aquifer (À9.5%) and the eastern Jurassic
border (À8.6%).
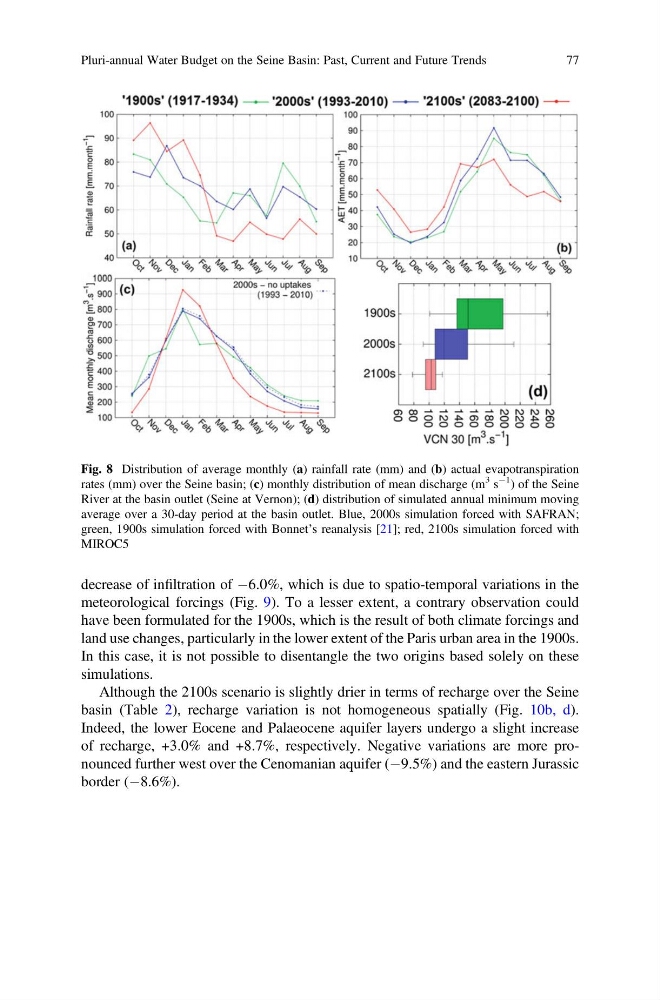
Fig. 8 Distribution of average monthly (a) rainfall rate (mm) and (b) actual evapotranspiration
rates (mm) over the Seine basin; (c) monthly distribution of mean discharge (m
3 s
À1
) of the Seine
River at the basin outlet (Seine at Vernon); (d) distribution of simulated annual minimum moving
average over a 30-day period at the basin outlet. Blue, 2000s simulation forced with SAFRAN;
green, 1900s simulation forced with Bonnet’s reanalysis [21]; red, 2100s simulation forced with
MIROC5
Pluri-annual Water Budget on the Seine Basin: Past, Current and Future Trends
77
meteorological forcings (Fig. 9). To a lesser extent, a contrary observation could
have been formulated for the 1900s, which is the result of both climate forcings and
land use changes, particularly in the lower extent of the Paris urban area in the 1900s.
In this case, it is not possible to disentangle the two origins based solely on these
simulations.
Although the 2100s scenario is slightly drier in terms of recharge over the Seine
basin (Table 2), recharge variation is not homogeneous spatially (Fig. 10b, d).
Indeed, the lower Eocene and Palaeocene aquifer layers undergo a slight increase
of recharge, +3.0% and +8.7%, respectively. Negative variations are more pronounced further west over the Cenomanian aquifer (À9.5%) and the eastern Jurassic
border (À8.6%).
Fig. 8 Distribution of average monthly (a) rainfall rate (mm) and (b) actual evapotranspiration
rates (mm) over the Seine basin; (c) monthly distribution of mean discharge (m
3 s
À1
) of the Seine
River at the basin outlet (Seine at Vernon); (d) distribution of simulated annual minimum moving
average over a 30-day period at the basin outlet. Blue, 2000s simulation forced with SAFRAN;
green, 1900s simulation forced with Bonnet’s reanalysis [21]; red, 2100s simulation forced with
MIROC5
Pluri-annual Water Budget on the Seine Basin: Past, Current and Future Trends
77