

flows are now artificially increased to sustain the summer water discharge in Paris,
some 150 river km downstream, by a factor 3–4.
Figure 7 shows the evolution of the Seine River and the adjacent alluvial plain as
depicted on a map from 1839 compared to the current situation, in the same area as
that shown in Fig. 6. This 1/5000 1839 map covers a portion of the Bassée floodplain
between Nogent-sur-Seine and Montereau-Fault-Yonne, 43 km long, 3–5 km wide,
totalling 14,828 ha. It was drawn by the engineers of the Ponts et Chaussées in
preparation for the first phase of the river works in this sector. The current situation
is recorded on the 1/25,000 Scan 25© map of the IGN.
In this sector of the Bassée, one can observe the Grand Gabarit canal which
has cut across the original meandering river course and created artificial and/or
re-profiled bank. Today the Bassée is still a major wetland sector, according to the
EU definition, but the riparian forest, its oxbows and other types of wetlands have
been transformed by dozens of sandpits, some of which, still in operation, are not yet
under water.
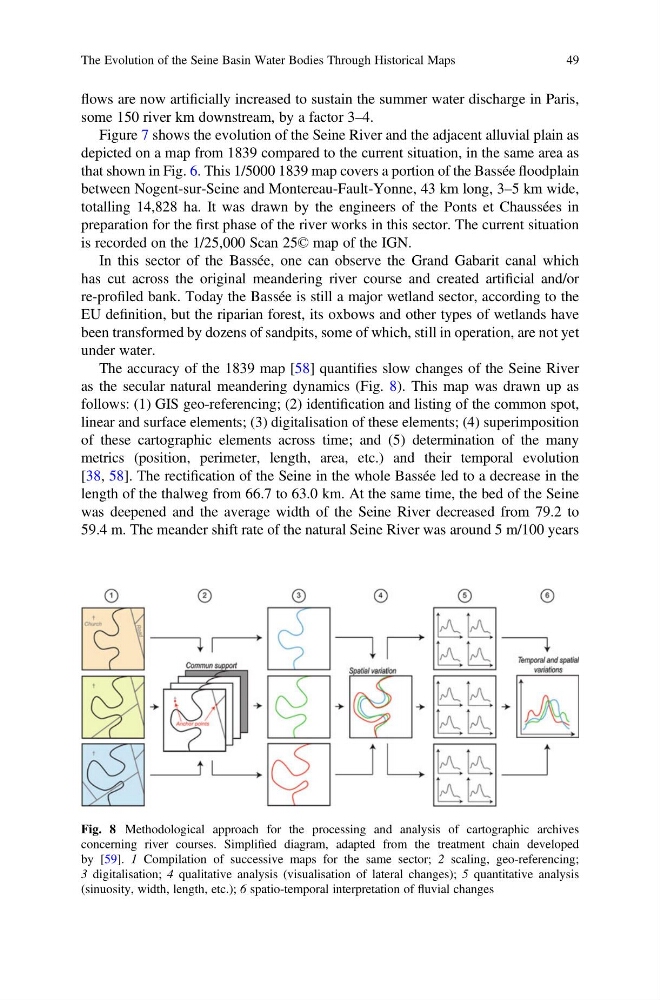
The accuracy of the 1839 map [58] quantifies slow changes of the Seine River
as the secular natural meandering dynamics (Fig. 8). This map was drawn up as
follows: (1) GIS geo-referencing; (2) identification and listing of the common spot,
linear and surface elements; (3) digitalisation of these elements; (4) superimposition
of these cartographic elements across time; and (5) determination of the many
metrics (position, perimeter, length, area, etc.) and their temporal evolution
[38, 58]. The rectification of the Seine in the whole Bassée led to a decrease in the
length of the thalweg from 66.7 to 63.0 km. At the same time, the bed of the Seine
was deepened and the average width of the Seine River decreased from 79.2 to
59.4 m. The meander shift rate of the natural Seine River was around 5 m/100 years
Fig. 8 Methodological approach for the processing and analysis of cartographic archives
concerning river courses. Simplified diagram, adapted from the treatment chain developed
by [59]. 1 Compilation of successive maps for the same sector; 2 scaling, geo-referencing;
3 digitalisation; 4 qualitative analysis (visualisation of lateral changes); 5 quantitative analysis
(sinuosity, width, length, etc.); 6 spatio-temporal interpretation of fluvial changes
The Evolution of the Seine Basin Water Bodies Through Historical Maps
49
some 150 river km downstream, by a factor 3–4.
Figure 7 shows the evolution of the Seine River and the adjacent alluvial plain as
depicted on a map from 1839 compared to the current situation, in the same area as
that shown in Fig. 6. This 1/5000 1839 map covers a portion of the Bassée floodplain
between Nogent-sur-Seine and Montereau-Fault-Yonne, 43 km long, 3–5 km wide,
totalling 14,828 ha. It was drawn by the engineers of the Ponts et Chaussées in
preparation for the first phase of the river works in this sector. The current situation
is recorded on the 1/25,000 Scan 25© map of the IGN.
In this sector of the Bassée, one can observe the Grand Gabarit canal which
has cut across the original meandering river course and created artificial and/or
re-profiled bank. Today the Bassée is still a major wetland sector, according to the
EU definition, but the riparian forest, its oxbows and other types of wetlands have
been transformed by dozens of sandpits, some of which, still in operation, are not yet
under water.
The accuracy of the 1839 map [58] quantifies slow changes of the Seine River
as the secular natural meandering dynamics (Fig. 8). This map was drawn up as
follows: (1) GIS geo-referencing; (2) identification and listing of the common spot,
linear and surface elements; (3) digitalisation of these elements; (4) superimposition
of these cartographic elements across time; and (5) determination of the many
metrics (position, perimeter, length, area, etc.) and their temporal evolution
[38, 58]. The rectification of the Seine in the whole Bassée led to a decrease in the
length of the thalweg from 66.7 to 63.0 km. At the same time, the bed of the Seine
was deepened and the average width of the Seine River decreased from 79.2 to
59.4 m. The meander shift rate of the natural Seine River was around 5 m/100 years
Fig. 8 Methodological approach for the processing and analysis of cartographic archives
concerning river courses. Simplified diagram, adapted from the treatment chain developed
by [59]. 1 Compilation of successive maps for the same sector; 2 scaling, geo-referencing;
3 digitalisation; 4 qualitative analysis (visualisation of lateral changes); 5 quantitative analysis
(sinuosity, width, length, etc.); 6 spatio-temporal interpretation of fluvial changes
The Evolution of the Seine Basin Water Bodies Through Historical Maps
49