

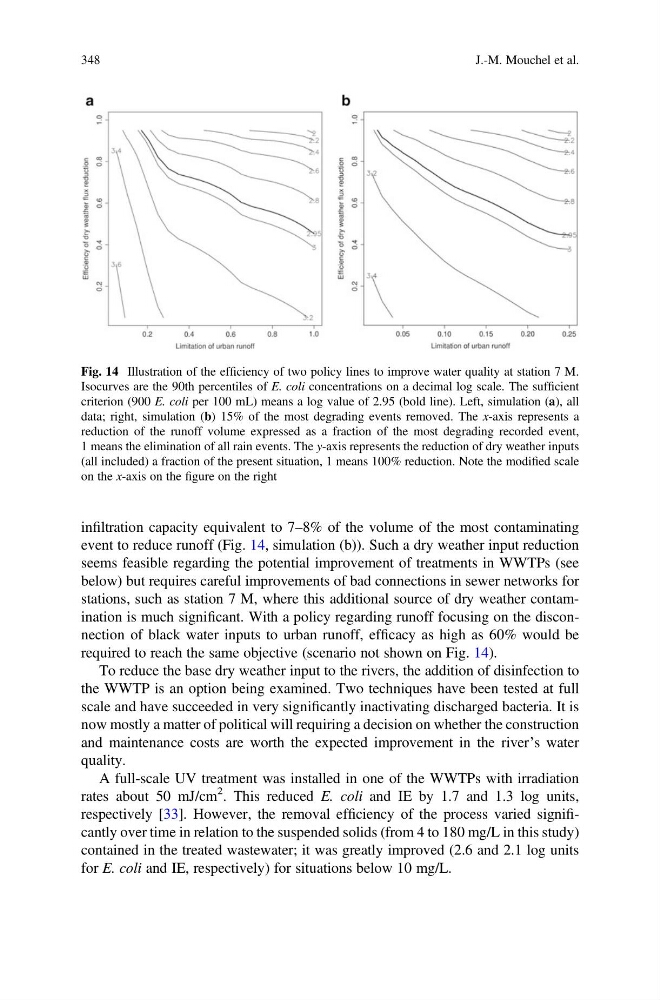
infiltration capacity equivalent to 7–8% of the volume of the most contaminating
event to reduce runoff (Fig. 14, simulation (b)). Such a dry weather input reduction
seems feasible regarding the potential improvement of treatments in WWTPs (see
below) but requires careful improvements of bad connections in sewer networks for
stations, such as station 7 M, where this additional source of dry weather contamination is much significant. With a policy regarding runoff focusing on the disconnection of black water inputs to urban runoff, efficacy as high as 60% would be
required to reach the same objective (scenario not shown on Fig. 14).
To reduce the base dry weather input to the rivers, the addition of disinfection to
the WWTP is an option being examined. Two techniques have been tested at full
scale and have succeeded in very significantly inactivating discharged bacteria. It is
now mostly a matter of political will requiring a decision on whether the construction
and maintenance costs are worth the expected improvement in the river’s water
quality.
A full-scale UV treatment was installed in one of the WWTPs with irradiation
rates about 50 mJ/cm
2 . This reduced E. coli and IE by 1.7 and 1.3 log units,
respectively [33]. However, the removal efficiency of the process varied significantly over time in relation to the suspended solids (from 4 to 180 mg/L in this study)
contained in the treated wastewater; it was greatly improved (2.6 and 2.1 log units
for E. coli and IE, respectively) for situations below 10 mg/L.
Fig. 14 Illustration of the efficiency of two policy lines to improve water quality at station 7 M.
Isocurves are the 90th percentiles of E. coli concentrations on a decimal log scale. The sufficient
criterion (900 E. coli per 100 mL) means a log value of 2.95 (bold line). Left, simulation (a), all
data; right, simulation (b) 15% of the most degrading events removed. The x-axis represents a
reduction of the runoff volume expressed as a fraction of the most degrading recorded event,
1 means the elimination of all rain events. The y-axis represents the reduction of dry weather inputs
(all included) a fraction of the present situation, 1 means 100% reduction. Note the modified scale
on the x-axis on the figure on the right
348
J.-M. Mouchel et al.
event to reduce runoff (Fig. 14, simulation (b)). Such a dry weather input reduction
seems feasible regarding the potential improvement of treatments in WWTPs (see
below) but requires careful improvements of bad connections in sewer networks for
stations, such as station 7 M, where this additional source of dry weather contamination is much significant. With a policy regarding runoff focusing on the disconnection of black water inputs to urban runoff, efficacy as high as 60% would be
required to reach the same objective (scenario not shown on Fig. 14).
To reduce the base dry weather input to the rivers, the addition of disinfection to
the WWTP is an option being examined. Two techniques have been tested at full
scale and have succeeded in very significantly inactivating discharged bacteria. It is
now mostly a matter of political will requiring a decision on whether the construction
and maintenance costs are worth the expected improvement in the river’s water
quality.
A full-scale UV treatment was installed in one of the WWTPs with irradiation
rates about 50 mJ/cm
2 . This reduced E. coli and IE by 1.7 and 1.3 log units,
respectively [33]. However, the removal efficiency of the process varied significantly over time in relation to the suspended solids (from 4 to 180 mg/L in this study)
contained in the treated wastewater; it was greatly improved (2.6 and 2.1 log units
for E. coli and IE, respectively) for situations below 10 mg/L.
Fig. 14 Illustration of the efficiency of two policy lines to improve water quality at station 7 M.
Isocurves are the 90th percentiles of E. coli concentrations on a decimal log scale. The sufficient
criterion (900 E. coli per 100 mL) means a log value of 2.95 (bold line). Left, simulation (a), all
data; right, simulation (b) 15% of the most degrading events removed. The x-axis represents a
reduction of the runoff volume expressed as a fraction of the most degrading recorded event,
1 means the elimination of all rain events. The y-axis represents the reduction of dry weather inputs
(all included) a fraction of the present situation, 1 means 100% reduction. Note the modified scale
on the x-axis on the figure on the right
348
J.-M. Mouchel et al.