

decay processes, since the observed slope is fully coherent with the decay rates
obtained from laboratory experiments. The small increase at station 10 M downstream of the MAV WWTP can be totally explained by the estimated inputs by the
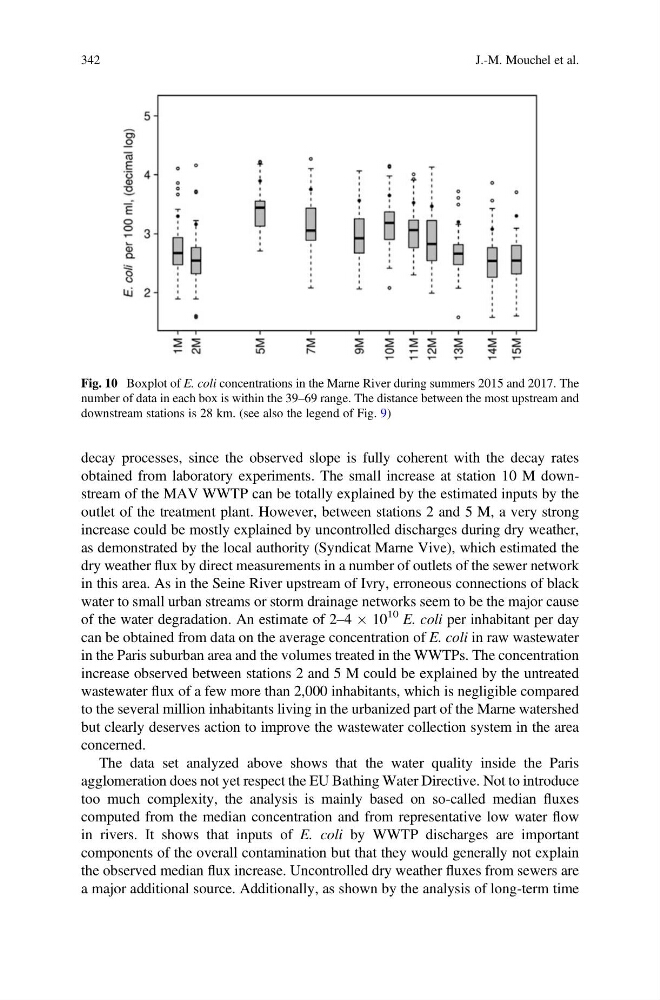
outlet of the treatment plant. However, between stations 2 and 5 M, a very strong
increase could be mostly explained by uncontrolled discharges during dry weather,
as demonstrated by the local authority (Syndicat Marne Vive), which estimated the
dry weather flux by direct measurements in a number of outlets of the sewer network
in this area. As in the Seine River upstream of Ivry, erroneous connections of black
water to small urban streams or storm drainage networks seem to be the major cause
of the water degradation. An estimate of 2–4 Â 10
10 E. coli per inhabitant per day
can be obtained from data on the average concentration of E. coli in raw wastewater
in the Paris suburban area and the volumes treated in the WWTPs. The concentration
increase observed between stations 2 and 5 M could be explained by the untreated
wastewater flux of a few more than 2,000 inhabitants, which is negligible compared
to the several million inhabitants living in the urbanized part of the Marne watershed
but clearly deserves action to improve the wastewater collection system in the area
concerned.
The data set analyzed above shows that the water quality inside the Paris
agglomeration does not yet respect the EU Bathing Water Directive. Not to introduce
too much complexity, the analysis is mainly based on so-called median fluxes
computed from the median concentration and from representative low water flow
in rivers. It shows that inputs of E. coli by WWTP discharges are important
components of the overall contamination but that they would generally not explain
the observed median flux increase. Uncontrolled dry weather fluxes from sewers are
a major additional source. Additionally, as shown by the analysis of long-term time
Fig. 10 Boxplot of E. coli concentrations in the Marne River during summers 2015 and 2017. The
number of data in each box is within the 39–69 range. The distance between the most upstream and
downstream stations is 28 km. (see also the legend of Fig. 9)
342
J.-M. Mouchel et al.
obtained from laboratory experiments. The small increase at station 10 M downstream of the MAV WWTP can be totally explained by the estimated inputs by the
outlet of the treatment plant. However, between stations 2 and 5 M, a very strong
increase could be mostly explained by uncontrolled discharges during dry weather,
as demonstrated by the local authority (Syndicat Marne Vive), which estimated the
dry weather flux by direct measurements in a number of outlets of the sewer network
in this area. As in the Seine River upstream of Ivry, erroneous connections of black
water to small urban streams or storm drainage networks seem to be the major cause
of the water degradation. An estimate of 2–4 Â 10
10 E. coli per inhabitant per day
can be obtained from data on the average concentration of E. coli in raw wastewater
in the Paris suburban area and the volumes treated in the WWTPs. The concentration
increase observed between stations 2 and 5 M could be explained by the untreated
wastewater flux of a few more than 2,000 inhabitants, which is negligible compared
to the several million inhabitants living in the urbanized part of the Marne watershed
but clearly deserves action to improve the wastewater collection system in the area
concerned.
The data set analyzed above shows that the water quality inside the Paris
agglomeration does not yet respect the EU Bathing Water Directive. Not to introduce
too much complexity, the analysis is mainly based on so-called median fluxes
computed from the median concentration and from representative low water flow
in rivers. It shows that inputs of E. coli by WWTP discharges are important
components of the overall contamination but that they would generally not explain
the observed median flux increase. Uncontrolled dry weather fluxes from sewers are
a major additional source. Additionally, as shown by the analysis of long-term time
Fig. 10 Boxplot of E. coli concentrations in the Marne River during summers 2015 and 2017. The
number of data in each box is within the 39–69 range. The distance between the most upstream and
downstream stations is 28 km. (see also the legend of Fig. 9)
342
J.-M. Mouchel et al.