

n ¼ 650) in the historical data for the period during which both parameters were
measured simultaneously. After verification of the data collected, E. coli’s annual
geometrical means were calculated for each year to limit any influence of highly
divergent results. The number of data taken into account per year varied from
4 to 254.
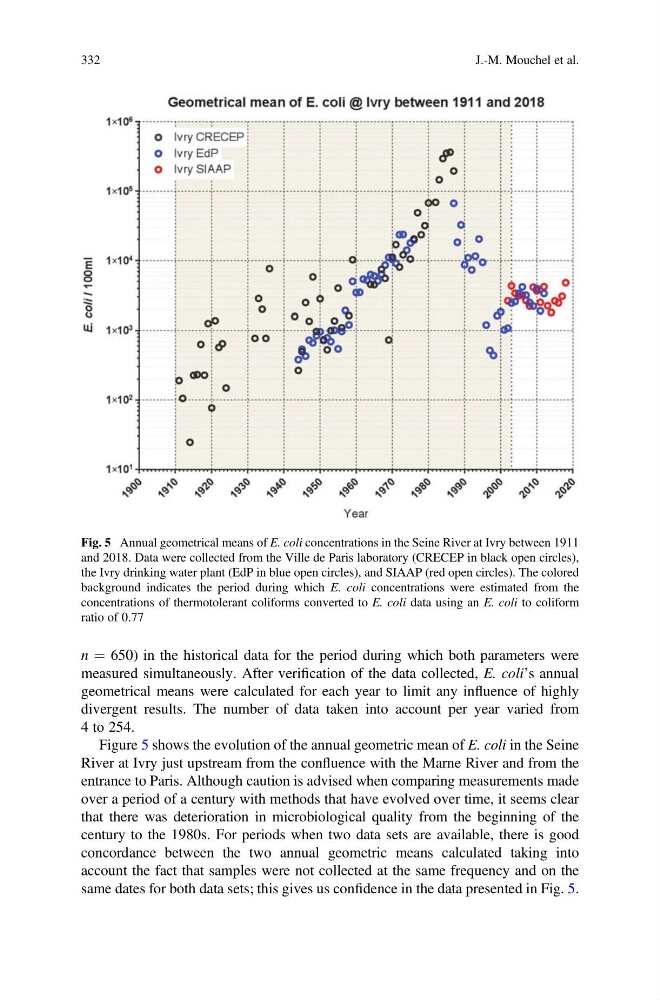
Figure 5 shows the evolution of the annual geometric mean of E. coli in the Seine
River at Ivry just upstream from the confluence with the Marne River and from the
entrance to Paris. Although caution is advised when comparing measurements made
over a period of a century with methods that have evolved over time, it seems clear
that there was deterioration in microbiological quality from the beginning of the
century to the 1980s. For periods when two data sets are available, there is good
concordance between the two annual geometric means calculated taking into
account the fact that samples were not collected at the same frequency and on the
same dates for both data sets; this gives us confidence in the data presented in Fig. 5.
Fig. 5 Annual geometrical means of E. coli concentrations in the Seine River at Ivry between 1911
and 2018. Data were collected from the Ville de Paris laboratory (CRECEP in black open circles),
the Ivry drinking water plant (EdP in blue open circles), and SIAAP (red open circles). The colored
background indicates the period during which E. coli concentrations were estimated from the
concentrations of thermotolerant coliforms converted to E. coli data using an E. coli to coliform
ratio of 0.77
332
J.-M. Mouchel et al.
measured simultaneously. After verification of the data collected, E. coli’s annual
geometrical means were calculated for each year to limit any influence of highly
divergent results. The number of data taken into account per year varied from
4 to 254.
Figure 5 shows the evolution of the annual geometric mean of E. coli in the Seine
River at Ivry just upstream from the confluence with the Marne River and from the
entrance to Paris. Although caution is advised when comparing measurements made
over a period of a century with methods that have evolved over time, it seems clear
that there was deterioration in microbiological quality from the beginning of the
century to the 1980s. For periods when two data sets are available, there is good
concordance between the two annual geometric means calculated taking into
account the fact that samples were not collected at the same frequency and on the
same dates for both data sets; this gives us confidence in the data presented in Fig. 5.
Fig. 5 Annual geometrical means of E. coli concentrations in the Seine River at Ivry between 1911
and 2018. Data were collected from the Ville de Paris laboratory (CRECEP in black open circles),
the Ivry drinking water plant (EdP in blue open circles), and SIAAP (red open circles). The colored
background indicates the period during which E. coli concentrations were estimated from the
concentrations of thermotolerant coliforms converted to E. coli data using an E. coli to coliform
ratio of 0.77
332
J.-M. Mouchel et al.