

contamination correspond to the dates of their first industrial uses: the 1950s for
PCBs, 1960s for APs and 1970s for PBDEs. PCBs and PBDEs present a sharp
increase, while AP increases are more gradual. The Tmax occurred between 1960
and 1972 for PCBs, between 1965–1975 and 1985–1995 for APs and after 1990 for
PBDEs. Finally, each of these peaks is followed by a period of sharp decrease,
according to the regulations and the means of available substitution products. For
example, a rapid decay of PCBs from 1972 to the 1980s was observed, followed by a
slower period of decay. This trend is further discussed in Sect. 8. For APs, a rapid
decrease has been observed since 1992 following the gradual restriction of their use,
initiated by the OSPAR convention on pollutant inputs into the Atlantic Ocean and
due to their substitution in detergents by other compounds such as PBDEs, which
show a plateau pattern over the 1995–2005 period.
4.1.2 Evolution of Contamination in the Estuary
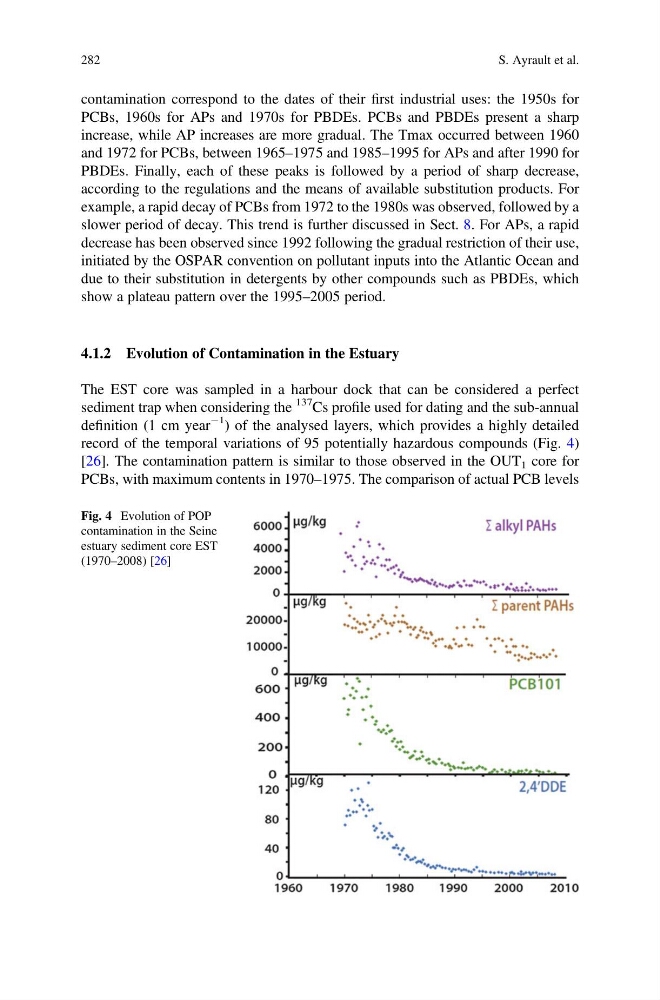
The EST core was sampled in a harbour dock that can be considered a perfect
sediment trap when considering the
137 Cs profile used for dating and the sub-annual
definition (1 cm year
À1 ) of the analysed layers, which provides a highly detailed
record of the temporal variations of 95 potentially hazardous compounds (Fig. 4)
[26]. The contamination pattern is similar to those observed in the OUT 1 core for
PCBs, with maximum contents in 1970–1975. The comparison of actual PCB levels
Fig. 4 Evolution of POP
contamination in the Seine
estuary sediment core EST
(1970–2008) [26]
282
S. Ayrault et al.
PCBs, 1960s for APs and 1970s for PBDEs. PCBs and PBDEs present a sharp
increase, while AP increases are more gradual. The Tmax occurred between 1960
and 1972 for PCBs, between 1965–1975 and 1985–1995 for APs and after 1990 for
PBDEs. Finally, each of these peaks is followed by a period of sharp decrease,
according to the regulations and the means of available substitution products. For
example, a rapid decay of PCBs from 1972 to the 1980s was observed, followed by a
slower period of decay. This trend is further discussed in Sect. 8. For APs, a rapid
decrease has been observed since 1992 following the gradual restriction of their use,
initiated by the OSPAR convention on pollutant inputs into the Atlantic Ocean and
due to their substitution in detergents by other compounds such as PBDEs, which
show a plateau pattern over the 1995–2005 period.
4.1.2 Evolution of Contamination in the Estuary
The EST core was sampled in a harbour dock that can be considered a perfect
sediment trap when considering the
137 Cs profile used for dating and the sub-annual
definition (1 cm year
À1 ) of the analysed layers, which provides a highly detailed
record of the temporal variations of 95 potentially hazardous compounds (Fig. 4)
[26]. The contamination pattern is similar to those observed in the OUT 1 core for
PCBs, with maximum contents in 1970–1975. The comparison of actual PCB levels
Fig. 4 Evolution of POP
contamination in the Seine
estuary sediment core EST
(1970–2008) [26]
282
S. Ayrault et al.