

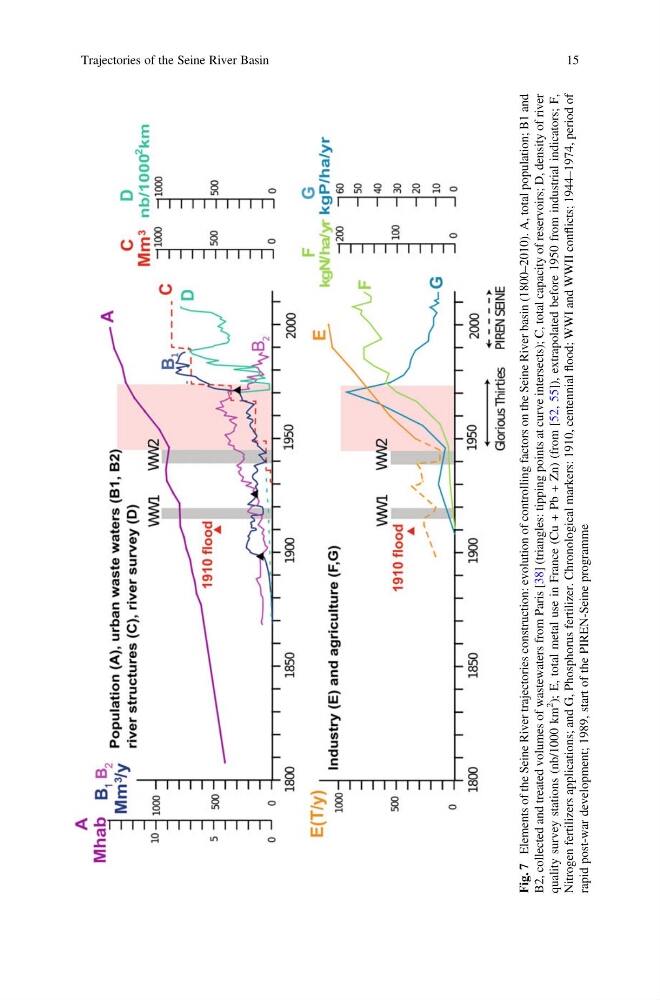
Fig. 7
Elements of the Seine River trajectories construction: evolution of controlling factors on the Seine River basin (1800–2010). A, total population; B1 and
B2, collected and treated volumes of wastewaters from Paris [38] (triangles: tipping points at curve intersects); C, total capacity of reservoirs; D, density of river
quality survey stations (nb/1000 km
2
); E, total metal use in France (Cu + Pb + Zn) (from [52, 55]), extrapolated before 1950 from industrial indicators; F,
Nitrogen fertilizers applications; and G, Phosphorus fertilizer. Chronological markers: 1910, centennial
flood; WWI and WWII conflicts; 1944–1974, period of
rapid post-war development; 1989, start of the PIREN-Seine programme
Trajectories of the Seine River Basin
15
Elements of the Seine River trajectories construction: evolution of controlling factors on the Seine River basin (1800–2010). A, total population; B1 and
B2, collected and treated volumes of wastewaters from Paris [38] (triangles: tipping points at curve intersects); C, total capacity of reservoirs; D, density of river
quality survey stations (nb/1000 km
2
); E, total metal use in France (Cu + Pb + Zn) (from [52, 55]), extrapolated before 1950 from industrial indicators; F,
Nitrogen fertilizers applications; and G, Phosphorus fertilizer. Chronological markers: 1910, centennial
flood; WWI and WWII conflicts; 1944–1974, period of
rapid post-war development; 1989, start of the PIREN-Seine programme
Trajectories of the Seine River Basin
15