

Both qualitative and quantitative variations of DOM were thus related to hydrological conditions (flood, low water) and specific geographical locations. The
results obtained with the various DOM characterisation tools used in this study are
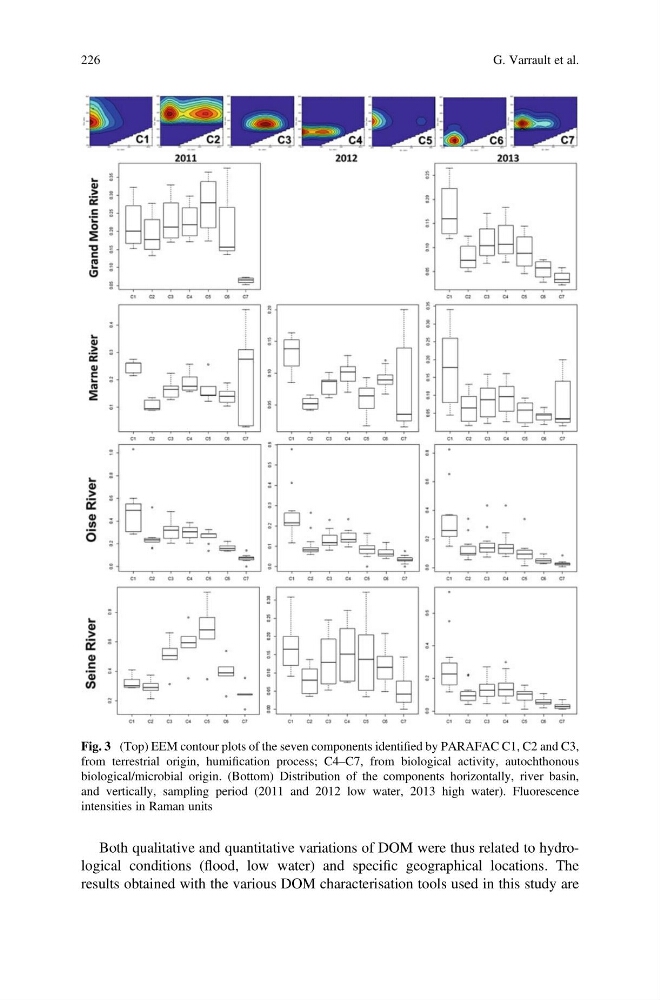
Fig. 3 (Top) EEM contour plots of the seven components identified by PARAFAC C1, C2 and C3,
from terrestrial origin, humification process; C4–C7, from biological activity, autochthonous
biological/microbial origin. (Bottom) Distribution of the components horizontally, river basin,
and vertically, sampling period (2011 and 2012 low water, 2013 high water). Fluorescence
intensities in Raman units
226
G. Varrault et al.
results obtained with the various DOM characterisation tools used in this study are
Fig. 3 (Top) EEM contour plots of the seven components identified by PARAFAC C1, C2 and C3,
from terrestrial origin, humification process; C4–C7, from biological activity, autochthonous
biological/microbial origin. (Bottom) Distribution of the components horizontally, river basin,
and vertically, sampling period (2011 and 2012 low water, 2013 high water). Fluorescence
intensities in Raman units
226
G. Varrault et al.