

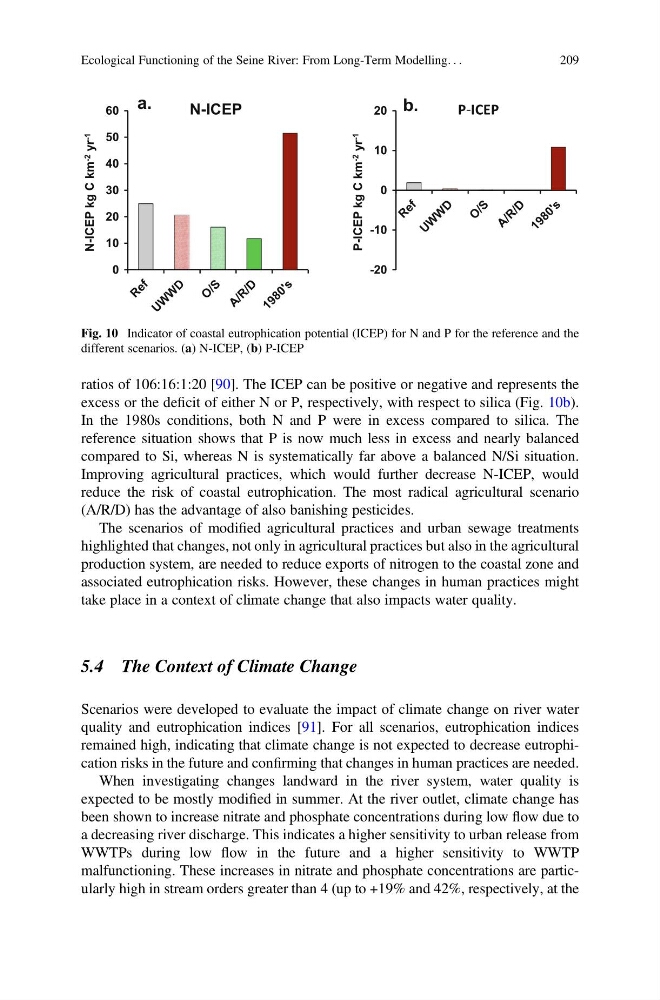
ratios of 106:16:1:20 [90]. The ICEP can be positive or negative and represents the
excess or the deficit of either N or P, respectively, with respect to silica (Fig. 10b).
In the 1980s conditions, both N and P were in excess compared to silica. The
reference situation shows that P is now much less in excess and nearly balanced
compared to Si, whereas N is systematically far above a balanced N/Si situation.
Improving agricultural practices, which would further decrease N-ICEP, would
reduce the risk of coastal eutrophication. The most radical agricultural scenario
(A/R/D) has the advantage of also banishing pesticides.
The scenarios of modified agricultural practices and urban sewage treatments
highlighted that changes, not only in agricultural practices but also in the agricultural
production system, are needed to reduce exports of nitrogen to the coastal zone and
associated eutrophication risks. However, these changes in human practices might
take place in a context of climate change that also impacts water quality.
5.4 The Context of Climate Change
Scenarios were developed to evaluate the impact of climate change on river water
quality and eutrophication indices [91]. For all scenarios, eutrophication indices
remained high, indicating that climate change is not expected to decrease eutrophication risks in the future and confirming that changes in human practices are needed.
When investigating changes landward in the river system, water quality is
expected to be mostly modified in summer. At the river outlet, climate change has
been shown to increase nitrate and phosphate concentrations during low flow due to
a decreasing river discharge. This indicates a higher sensitivity to urban release from
WWTPs during low flow in the future and a higher sensitivity to WWTP
malfunctioning. These increases in nitrate and phosphate concentrations are particularly high in stream orders greater than 4 (up to +19% and 42%, respectively, at the
0
10
20
30
40
50
60
N-ICEP kg C km -2
yr -1
N-ICEP
-20
-10
0
10
20
P-ICEP kg C km -2
yr -1
P‐ICEP
a.
b.
Fig. 10 Indicator of coastal eutrophication potential (ICEP) for N and P for the reference and the
different scenarios. (a) N-ICEP, (b) P-ICEP
Ecological Functioning of the Seine River: From Long-Term Modelling. . .
209
excess or the deficit of either N or P, respectively, with respect to silica (Fig. 10b).
In the 1980s conditions, both N and P were in excess compared to silica. The
reference situation shows that P is now much less in excess and nearly balanced
compared to Si, whereas N is systematically far above a balanced N/Si situation.
Improving agricultural practices, which would further decrease N-ICEP, would
reduce the risk of coastal eutrophication. The most radical agricultural scenario
(A/R/D) has the advantage of also banishing pesticides.
The scenarios of modified agricultural practices and urban sewage treatments
highlighted that changes, not only in agricultural practices but also in the agricultural
production system, are needed to reduce exports of nitrogen to the coastal zone and
associated eutrophication risks. However, these changes in human practices might
take place in a context of climate change that also impacts water quality.
5.4 The Context of Climate Change
Scenarios were developed to evaluate the impact of climate change on river water
quality and eutrophication indices [91]. For all scenarios, eutrophication indices
remained high, indicating that climate change is not expected to decrease eutrophication risks in the future and confirming that changes in human practices are needed.
When investigating changes landward in the river system, water quality is
expected to be mostly modified in summer. At the river outlet, climate change has
been shown to increase nitrate and phosphate concentrations during low flow due to
a decreasing river discharge. This indicates a higher sensitivity to urban release from
WWTPs during low flow in the future and a higher sensitivity to WWTP
malfunctioning. These increases in nitrate and phosphate concentrations are particularly high in stream orders greater than 4 (up to +19% and 42%, respectively, at the
0
10
20
30
40
50
60
N-ICEP kg C km -2
yr -1
N-ICEP
-20
-10
0
10
20
P-ICEP kg C km -2
yr -1
P‐ICEP
a.
b.
Fig. 10 Indicator of coastal eutrophication potential (ICEP) for N and P for the reference and the
different scenarios. (a) N-ICEP, (b) P-ICEP
Ecological Functioning of the Seine River: From Long-Term Modelling. . .
209