

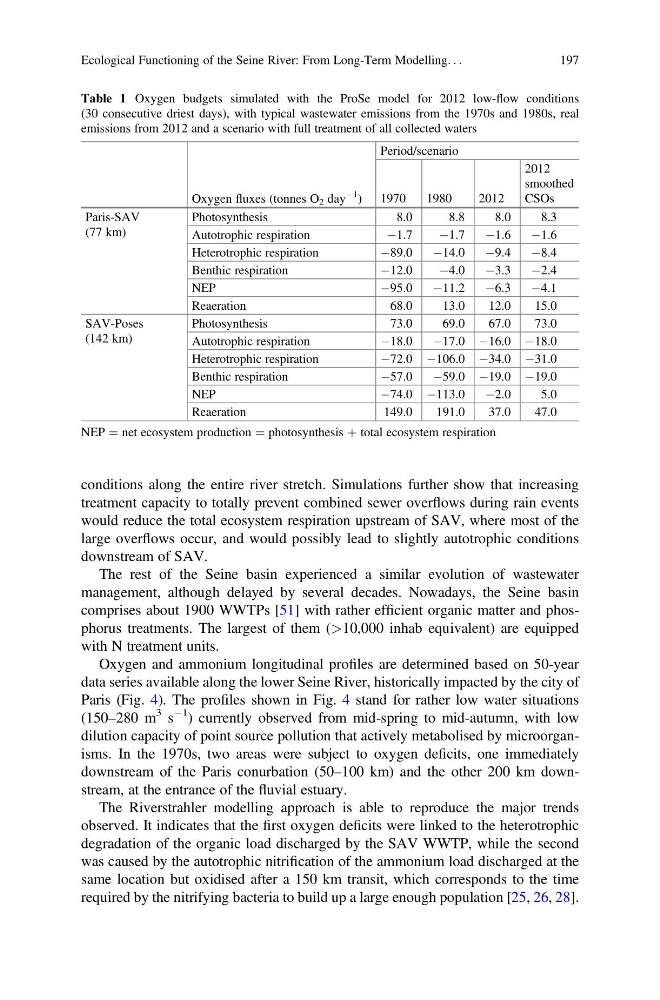
conditions along the entire river stretch. Simulations further show that increasing
treatment capacity to totally prevent combined sewer overflows during rain events
would reduce the total ecosystem respiration upstream of SAV, where most of the
large overflows occur, and would possibly lead to slightly autotrophic conditions
downstream of SAV.
The rest of the Seine basin experienced a similar evolution of wastewater
management, although delayed by several decades. Nowadays, the Seine basin
comprises about 1900 WWTPs [51] with rather efficient organic matter and phosphorus treatments. The largest of them (>10,000 inhab equivalent) are equipped
with N treatment units.
Oxygen and ammonium longitudinal profiles are determined based on 50-year
data series available along the lower Seine River, historically impacted by the city of
Paris (Fig. 4). The profiles shown in Fig. 4 stand for rather low water situations
(150–280 m
3 s
À1 ) currently observed from mid-spring to mid-autumn, with low
dilution capacity of point source pollution that actively metabolised by microorganisms. In the 1970s, two areas were subject to oxygen deficits, one immediately
downstream of the Paris conurbation (50–100 km) and the other 200 km downstream, at the entrance of the fluvial estuary.
The Riverstrahler modelling approach is able to reproduce the major trends
observed. It indicates that the first oxygen deficits were linked to the heterotrophic
degradation of the organic load discharged by the SAV WWTP, while the second
was caused by the autotrophic nitrification of the ammonium load discharged at the
same location but oxidised after a 150 km transit, which corresponds to the time
required by the nitrifying bacteria to build up a large enough population [25, 26, 28].
Table 1 Oxygen budgets simulated with the ProSe model for 2012 low-flow conditions
(30 consecutive driest days), with typical wastewater emissions from the 1970s and 1980s, real
emissions from 2012 and a scenario with full treatment of all collected waters
Oxygen fluxes (tonnes O 2 day
À1
)
Period/scenario
1970
1980
2012
2012
smoothed
CSOs
Paris-SAV
(77 km)
Photosynthesis
8.0
8.8
8.0
8.3
Autotrophic respiration
À1.7
À1.7
À1.6
À1.6
Heterotrophic respiration
À89.0
À14.0
À9.4
À8.4
Benthic respiration
À12.0
À4.0
À3.3
À2.4
NEP
À95.0
À11.2
À6.3
À4.1
Reaeration
68.0
13.0
12.0
15.0
SAV-Poses
(142 km)
Photosynthesis
73.0
69.0
67.0
73.0
Autotrophic respiration
À18.0
À17.0 À16.0 À18.0
Heterotrophic respiration
À72.0 À106.0 À34.0 À31.0
Benthic respiration
À57.0
À59.0 À19.0 À19.0
NEP
À74.0 À113.0
À2.0
5.0
Reaeration
149.0
191.0
37.0
47.0
NEP ¼ net ecosystem production ¼ photosynthesis þ total ecosystem respiration
Ecological Functioning of the Seine River: From Long-Term Modelling. . .
197
treatment capacity to totally prevent combined sewer overflows during rain events
would reduce the total ecosystem respiration upstream of SAV, where most of the
large overflows occur, and would possibly lead to slightly autotrophic conditions
downstream of SAV.
The rest of the Seine basin experienced a similar evolution of wastewater
management, although delayed by several decades. Nowadays, the Seine basin
comprises about 1900 WWTPs [51] with rather efficient organic matter and phosphorus treatments. The largest of them (>10,000 inhab equivalent) are equipped
with N treatment units.
Oxygen and ammonium longitudinal profiles are determined based on 50-year
data series available along the lower Seine River, historically impacted by the city of
Paris (Fig. 4). The profiles shown in Fig. 4 stand for rather low water situations
(150–280 m
3 s
À1 ) currently observed from mid-spring to mid-autumn, with low
dilution capacity of point source pollution that actively metabolised by microorganisms. In the 1970s, two areas were subject to oxygen deficits, one immediately
downstream of the Paris conurbation (50–100 km) and the other 200 km downstream, at the entrance of the fluvial estuary.
The Riverstrahler modelling approach is able to reproduce the major trends
observed. It indicates that the first oxygen deficits were linked to the heterotrophic
degradation of the organic load discharged by the SAV WWTP, while the second
was caused by the autotrophic nitrification of the ammonium load discharged at the
same location but oxidised after a 150 km transit, which corresponds to the time
required by the nitrifying bacteria to build up a large enough population [25, 26, 28].
Table 1 Oxygen budgets simulated with the ProSe model for 2012 low-flow conditions
(30 consecutive driest days), with typical wastewater emissions from the 1970s and 1980s, real
emissions from 2012 and a scenario with full treatment of all collected waters
Oxygen fluxes (tonnes O 2 day
À1
)
Period/scenario
1970
1980
2012
2012
smoothed
CSOs
Paris-SAV
(77 km)
Photosynthesis
8.0
8.8
8.0
8.3
Autotrophic respiration
À1.7
À1.7
À1.6
À1.6
Heterotrophic respiration
À89.0
À14.0
À9.4
À8.4
Benthic respiration
À12.0
À4.0
À3.3
À2.4
NEP
À95.0
À11.2
À6.3
À4.1
Reaeration
68.0
13.0
12.0
15.0
SAV-Poses
(142 km)
Photosynthesis
73.0
69.0
67.0
73.0
Autotrophic respiration
À18.0
À17.0 À16.0 À18.0
Heterotrophic respiration
À72.0 À106.0 À34.0 À31.0
Benthic respiration
À57.0
À59.0 À19.0 À19.0
NEP
À74.0 À113.0
À2.0
5.0
Reaeration
149.0
191.0
37.0
47.0
NEP ¼ net ecosystem production ¼ photosynthesis þ total ecosystem respiration
Ecological Functioning of the Seine River: From Long-Term Modelling. . .
197