

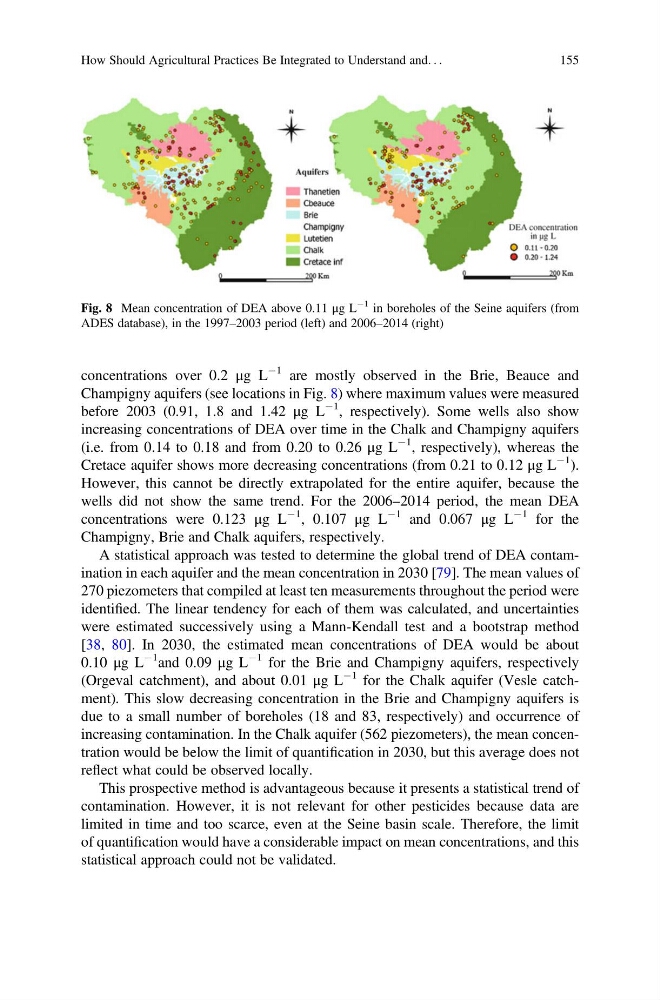
concentrations over 0.2 μg L
À1 are mostly observed in the Brie, Beauce and
Champigny aquifers (see locations in Fig. 8) where maximum values were measured
before 2003 (0.91, 1.8 and 1.42 μg L
À1 , respectively). Some wells also show
increasing concentrations of DEA over time in the Chalk and Champigny aquifers
(i.e. from 0.14 to 0.18 and from 0.20 to 0.26 μg L
À1 , respectively), whereas the
Cretace aquifer shows more decreasing concentrations (from 0.21 to 0.12 μg L
À1 ).
However, this cannot be directly extrapolated for the entire aquifer, because the
wells did not show the same trend. For the 2006–2014 period, the mean DEA
concentrations were 0.123 μg L
À1
, 0.107 μg L
À1 and 0.067 μg L
À1 for the
Champigny, Brie and Chalk aquifers, respectively.
A statistical approach was tested to determine the global trend of DEA contamination in each aquifer and the mean concentration in 2030 [79]. The mean values of
270 piezometers that compiled at least ten measurements throughout the period were
identified. The linear tendency for each of them was calculated, and uncertainties
were estimated successively using a Mann-Kendall test and a bootstrap method
[38, 80]. In 2030, the estimated mean concentrations of DEA would be about
0.10 μg L
À1 and 0.09 μg L
À1 for the Brie and Champigny aquifers, respectively
(Orgeval catchment), and about 0.01 μg L
À1 for the Chalk aquifer (Vesle catchment). This slow decreasing concentration in the Brie and Champigny aquifers is
due to a small number of boreholes (18 and 83, respectively) and occurrence of
increasing contamination. In the Chalk aquifer (562 piezometers), the mean concentration would be below the limit of quantification in 2030, but this average does not
reflect what could be observed locally.
This prospective method is advantageous because it presents a statistical trend of
contamination. However, it is not relevant for other pesticides because data are
limited in time and too scarce, even at the Seine basin scale. Therefore, the limit
of quantification would have a considerable impact on mean concentrations, and this
statistical approach could not be validated.
Fig. 8 Mean concentration of DEA above 0.11 μg L
À1 in boreholes of the Seine aquifers (from
ADES database), in the 1997–2003 period (left) and 2006–2014 (right)
How Should Agricultural Practices Be Integrated to Understand and. . .
155
À1 are mostly observed in the Brie, Beauce and
Champigny aquifers (see locations in Fig. 8) where maximum values were measured
before 2003 (0.91, 1.8 and 1.42 μg L
À1 , respectively). Some wells also show
increasing concentrations of DEA over time in the Chalk and Champigny aquifers
(i.e. from 0.14 to 0.18 and from 0.20 to 0.26 μg L
À1 , respectively), whereas the
Cretace aquifer shows more decreasing concentrations (from 0.21 to 0.12 μg L
À1 ).
However, this cannot be directly extrapolated for the entire aquifer, because the
wells did not show the same trend. For the 2006–2014 period, the mean DEA
concentrations were 0.123 μg L
À1
, 0.107 μg L
À1 and 0.067 μg L
À1 for the
Champigny, Brie and Chalk aquifers, respectively.
A statistical approach was tested to determine the global trend of DEA contamination in each aquifer and the mean concentration in 2030 [79]. The mean values of
270 piezometers that compiled at least ten measurements throughout the period were
identified. The linear tendency for each of them was calculated, and uncertainties
were estimated successively using a Mann-Kendall test and a bootstrap method
[38, 80]. In 2030, the estimated mean concentrations of DEA would be about
0.10 μg L
À1 and 0.09 μg L
À1 for the Brie and Champigny aquifers, respectively
(Orgeval catchment), and about 0.01 μg L
À1 for the Chalk aquifer (Vesle catchment). This slow decreasing concentration in the Brie and Champigny aquifers is
due to a small number of boreholes (18 and 83, respectively) and occurrence of
increasing contamination. In the Chalk aquifer (562 piezometers), the mean concentration would be below the limit of quantification in 2030, but this average does not
reflect what could be observed locally.
This prospective method is advantageous because it presents a statistical trend of
contamination. However, it is not relevant for other pesticides because data are
limited in time and too scarce, even at the Seine basin scale. Therefore, the limit
of quantification would have a considerable impact on mean concentrations, and this
statistical approach could not be validated.
Fig. 8 Mean concentration of DEA above 0.11 μg L
À1 in boreholes of the Seine aquifers (from
ADES database), in the 1997–2003 period (left) and 2006–2014 (right)
How Should Agricultural Practices Be Integrated to Understand and. . .
155