

the vadose zone and aquifers make modelling more complex, and the mosaic of
cropping systems must be associated with the diversity of soil types and the
thickness of the unsaturated zone [21, 78].
In the first step, a prospective approach was implemented to understand pesticide
contamination of groundwater in the Seine basin, again using the ADES database
[15], in which pesticide contamination has been documented since 1997. As DEA is
the most widely detected pesticide residue in water, it was possible to use this
national monitoring database to understand the temporal evolution of the contamination. The mean concentrations of two different periods were compared: the first
one from 1997 to 2003 corresponding to the use of atrazine (Fig. 8, left) and the
second one from 2006 to 2014 (Fig. 8, right). Data between 2003 and 2005 were
considered as a transition period when atrazine was still used by farmers (finishing
stocks).
DEA was analysed on 1,436 piezometers, but many wells presented values below
the limit of quantification. A value reported as below the limit of quantification was
assigned a value of one-half of the limit of quantification. As this limit decreases
over time from 0.1 to 0.005 μg L
À1 , then the mean values can decrease over time due
to the limit of quantification even if DEA was never detected. To better represent the
evolution of DEA contamination, only mean values over 0.11 μg L
À1 were considered (Fig. 8). This approach allowed us to focus on contaminated wells. Mean
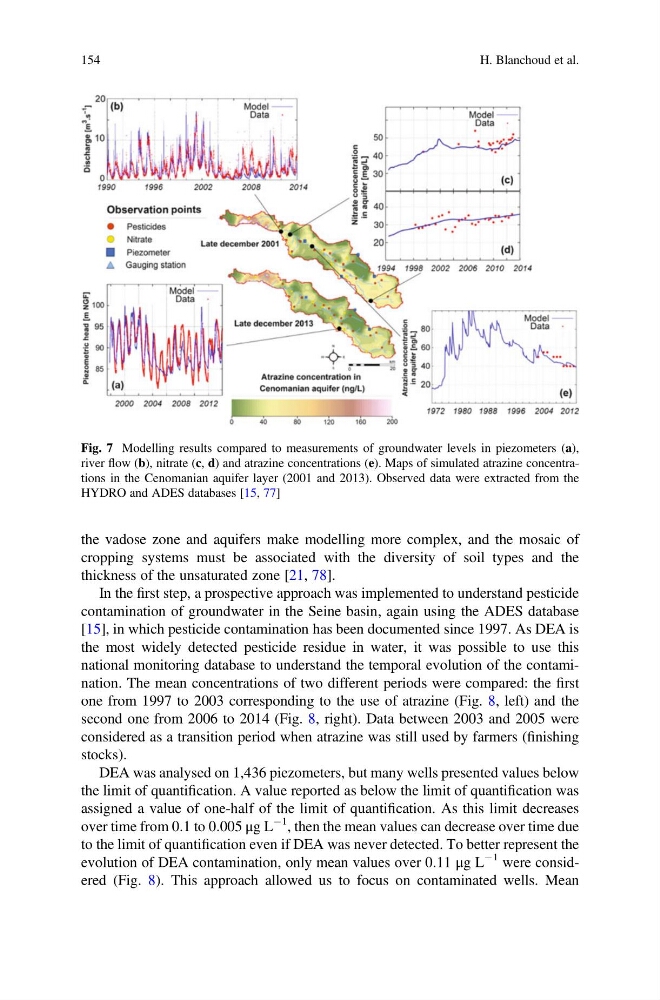
Fig. 7 Modelling results compared to measurements of groundwater levels in piezometers (a),
river flow (b), nitrate (c, d) and atrazine concentrations (e). Maps of simulated atrazine concentrations in the Cenomanian aquifer layer (2001 and 2013). Observed data were extracted from the
HYDRO and ADES databases [15, 77]
154
H. Blanchoud et al.
cropping systems must be associated with the diversity of soil types and the
thickness of the unsaturated zone [21, 78].
In the first step, a prospective approach was implemented to understand pesticide
contamination of groundwater in the Seine basin, again using the ADES database
[15], in which pesticide contamination has been documented since 1997. As DEA is
the most widely detected pesticide residue in water, it was possible to use this
national monitoring database to understand the temporal evolution of the contamination. The mean concentrations of two different periods were compared: the first
one from 1997 to 2003 corresponding to the use of atrazine (Fig. 8, left) and the
second one from 2006 to 2014 (Fig. 8, right). Data between 2003 and 2005 were
considered as a transition period when atrazine was still used by farmers (finishing
stocks).
DEA was analysed on 1,436 piezometers, but many wells presented values below
the limit of quantification. A value reported as below the limit of quantification was
assigned a value of one-half of the limit of quantification. As this limit decreases
over time from 0.1 to 0.005 μg L
À1 , then the mean values can decrease over time due
to the limit of quantification even if DEA was never detected. To better represent the
evolution of DEA contamination, only mean values over 0.11 μg L
À1 were considered (Fig. 8). This approach allowed us to focus on contaminated wells. Mean
Fig. 7 Modelling results compared to measurements of groundwater levels in piezometers (a),
river flow (b), nitrate (c, d) and atrazine concentrations (e). Maps of simulated atrazine concentrations in the Cenomanian aquifer layer (2001 and 2013). Observed data were extracted from the
HYDRO and ADES databases [15, 77]
154
H. Blanchoud et al.