

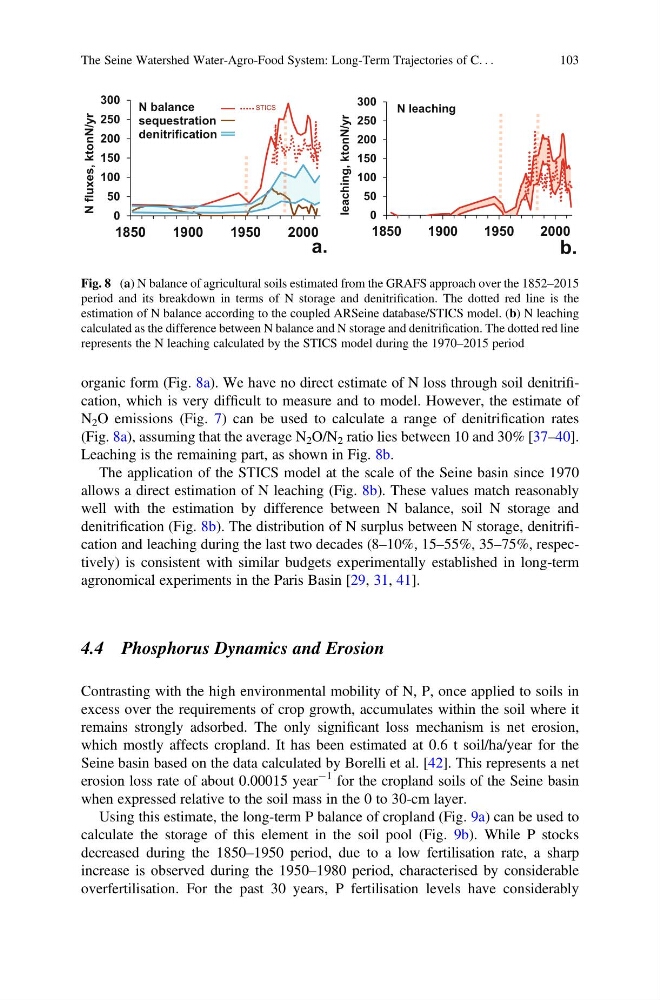
organic form (Fig. 8a). We have no direct estimate of N loss through soil denitrification, which is very difficult to measure and to model. However, the estimate of
N 2 O emissions (Fig. 7) can be used to calculate a range of denitrification rates
(Fig. 8a), assuming that the average N 2 O/N 2 ratio lies between 10 and 30% [37–40].
Leaching is the remaining part, as shown in Fig. 8b.
The application of the STICS model at the scale of the Seine basin since 1970
allows a direct estimation of N leaching (Fig. 8b). These values match reasonably
well with the estimation by difference between N balance, soil N storage and
denitrification (Fig. 8b). The distribution of N surplus between N storage, denitrification and leaching during the last two decades (8–10%, 15–55%, 35–75%, respectively) is consistent with similar budgets experimentally established in long-term
agronomical experiments in the Paris Basin [29, 31, 41].
4.4 Phosphorus Dynamics and Erosion
Contrasting with the high environmental mobility of N, P, once applied to soils in
excess over the requirements of crop growth, accumulates within the soil where it
remains strongly adsorbed. The only significant loss mechanism is net erosion,
which mostly affects cropland. It has been estimated at 0.6 t soil/ha/year for the
Seine basin based on the data calculated by Borelli et al. [42]. This represents a net
erosion loss rate of about 0.00015 year
À1 for the cropland soils of the Seine basin
when expressed relative to the soil mass in the 0 to 30-cm layer.
Using this estimate, the long-term P balance of cropland (Fig. 9a) can be used to
calculate the storage of this element in the soil pool (Fig. 9b). While P stocks
decreased during the 1850–1950 period, due to a low fertilisation rate, a sharp
increase is observed during the 1950–1980 period, characterised by considerable
overfertilisation. For the past 30 years, P fertilisation levels have considerably
0
50
100
150
200
250
300
1850
1900
1950
2000
leaching, ktonN/yr
N leaching
a.
b.
0
50
100
150
200
250
300
1850
1900
1950
2000
N fluxes, ktonN/yr
N balance
sequestration
denitrification
STICS
Fig. 8 (a) N balance of agricultural soils estimated from the GRAFS approach over the 1852–2015
period and its breakdown in terms of N storage and denitrification. The dotted red line is the
estimation of N balance according to the coupled ARSeine database/STICS model. (b) N leaching
calculated as the difference between N balance and N storage and denitrification. The dotted red line
represents the N leaching calculated by the STICS model during the 1970–2015 period
The Seine Watershed Water-Agro-Food System: Long-Term Trajectories of C. . .
103
N 2 O emissions (Fig. 7) can be used to calculate a range of denitrification rates
(Fig. 8a), assuming that the average N 2 O/N 2 ratio lies between 10 and 30% [37–40].
Leaching is the remaining part, as shown in Fig. 8b.
The application of the STICS model at the scale of the Seine basin since 1970
allows a direct estimation of N leaching (Fig. 8b). These values match reasonably
well with the estimation by difference between N balance, soil N storage and
denitrification (Fig. 8b). The distribution of N surplus between N storage, denitrification and leaching during the last two decades (8–10%, 15–55%, 35–75%, respectively) is consistent with similar budgets experimentally established in long-term
agronomical experiments in the Paris Basin [29, 31, 41].
4.4 Phosphorus Dynamics and Erosion
Contrasting with the high environmental mobility of N, P, once applied to soils in
excess over the requirements of crop growth, accumulates within the soil where it
remains strongly adsorbed. The only significant loss mechanism is net erosion,
which mostly affects cropland. It has been estimated at 0.6 t soil/ha/year for the
Seine basin based on the data calculated by Borelli et al. [42]. This represents a net
erosion loss rate of about 0.00015 year
À1 for the cropland soils of the Seine basin
when expressed relative to the soil mass in the 0 to 30-cm layer.
Using this estimate, the long-term P balance of cropland (Fig. 9a) can be used to
calculate the storage of this element in the soil pool (Fig. 9b). While P stocks
decreased during the 1850–1950 period, due to a low fertilisation rate, a sharp
increase is observed during the 1950–1980 period, characterised by considerable
overfertilisation. For the past 30 years, P fertilisation levels have considerably
0
50
100
150
200
250
300
1850
1900
1950
2000
leaching, ktonN/yr
N leaching
a.
b.
0
50
100
150
200
250
300
1850
1900
1950
2000
N fluxes, ktonN/yr
N balance
sequestration
denitrification
STICS
Fig. 8 (a) N balance of agricultural soils estimated from the GRAFS approach over the 1852–2015
period and its breakdown in terms of N storage and denitrification. The dotted red line is the
estimation of N balance according to the coupled ARSeine database/STICS model. (b) N leaching
calculated as the difference between N balance and N storage and denitrification. The dotted red line
represents the N leaching calculated by the STICS model during the 1970–2015 period
The Seine Watershed Water-Agro-Food System: Long-Term Trajectories of C. . .
103