

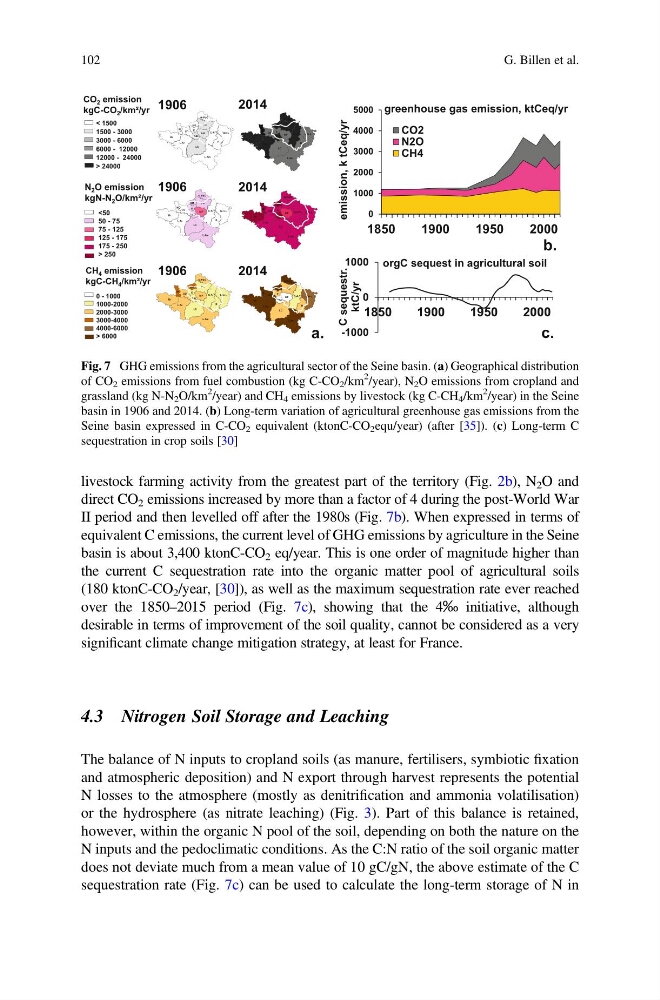
livestock farming activity from the greatest part of the territory (Fig. 2b), N 2 O and
direct CO 2 emissions increased by more than a factor of 4 during the post-World War
II period and then levelled off after the 1980s (Fig. 7b). When expressed in terms of
equivalent C emissions, the current level of GHG emissions by agriculture in the Seine
basin is about 3,400 ktonC-CO 2 eq/year. This is one order of magnitude higher than
the current C sequestration rate into the organic matter pool of agricultural soils
(180 ktonC-CO 2 /year, [30]), as well as the maximum sequestration rate ever reached
over the 1850–2015 period (Fig. 7c), showing that the 4‰ initiative, although
desirable in terms of improvement of the soil quality, cannot be considered as a very
significant climate change mitigation strategy, at least for France.
4.3 Nitrogen Soil Storage and Leaching
The balance of N inputs to cropland soils (as manure, fertilisers, symbiotic fixation
and atmospheric deposition) and N export through harvest represents the potential
N losses to the atmosphere (mostly as denitrification and ammonia volatilisation)
or the hydrosphere (as nitrate leaching) (Fig. 3). Part of this balance is retained,
however, within the organic N pool of the soil, depending on both the nature on the
N inputs and the pedoclimatic conditions. As the C:N ratio of the soil organic matter
does not deviate much from a mean value of 10 gC/gN, the above estimate of the C
sequestration rate (Fig. 7c) can be used to calculate the long-term storage of N in
-1000
0
1000
1850
1900
1950
2000
C sequestr.
ktC/yr
orgC sequest in agricultural soil
1906
N-PdC
L Am
LC
L Av
Pic
M
SM
Gde L
IdF
E
E&L
Br
CO
B
1906
N-PdC
L Am
LC
L Av
Pic
M
SM
Gde L
IdF
E
E&L
Br
CO
B
1906
N-PdC
L Am
LC
L Av
Pic
M
SM
Gde L
IdF
E
E&L
Br
CO
B
2014
N-PdC
L Am
LC
L Av
Pic
M
SM
Gde L
IdF
E
E&L
Br
CO
B
2014
N-PdC
L Am
LC
L Av
Pic
M
SM
Gde L
IdF
E
E&L
Br
CO
B
2014
N-PdC
L Am
LC
L Av
Pic
M
SM
Gde L
IdF
E
E&L
Br
CO
B
0 - 1000
1000-2000
2000-3000
3000-4000
4000-6000
> 6000
CH 4 emission
kgC-CH 4 /km²/yr
N 2 O emission
kgN-N 2 O/km²/yr
<50
50 - 75
75 - 125
125 - 175
175 - 250
> 250
< 1500
1500 - 3000
3000 - 6000
6000 - 12000
12000 - 24000
> 24000
CO 2 emission
kgC-CO 2 /km²/yr
a.
b.
c.
0
1000
2000
3000
4000
5000
1850
1900
1950
2000
emission, k tCeq/yr
CO2
N2O
CH4
greenhouse gas emission, ktCeq/yr
1906
1906
1906
2014
2014
2014
Fig. 7 GHG emissions from the agricultural sector of the Seine basin. (a) Geographical distribution
of CO 2 emissions from fuel combustion (kg C-CO 2 /km
2
/year), N 2 O emissions from cropland and
grassland (kg N-N 2 O/km
2
/year) and CH 4 emissions by livestock (kg C-CH 4 /km
2
/year) in the Seine
basin in 1906 and 2014. (b) Long-term variation of agricultural greenhouse gas emissions from the
Seine basin expressed in C-CO 2 equivalent (ktonC-CO 2 equ/year) (after [35]). (c) Long-term C
sequestration in crop soils [30]
102
G. Billen et al.
direct CO 2 emissions increased by more than a factor of 4 during the post-World War
II period and then levelled off after the 1980s (Fig. 7b). When expressed in terms of
equivalent C emissions, the current level of GHG emissions by agriculture in the Seine
basin is about 3,400 ktonC-CO 2 eq/year. This is one order of magnitude higher than
the current C sequestration rate into the organic matter pool of agricultural soils
(180 ktonC-CO 2 /year, [30]), as well as the maximum sequestration rate ever reached
over the 1850–2015 period (Fig. 7c), showing that the 4‰ initiative, although
desirable in terms of improvement of the soil quality, cannot be considered as a very
significant climate change mitigation strategy, at least for France.
4.3 Nitrogen Soil Storage and Leaching
The balance of N inputs to cropland soils (as manure, fertilisers, symbiotic fixation
and atmospheric deposition) and N export through harvest represents the potential
N losses to the atmosphere (mostly as denitrification and ammonia volatilisation)
or the hydrosphere (as nitrate leaching) (Fig. 3). Part of this balance is retained,
however, within the organic N pool of the soil, depending on both the nature on the
N inputs and the pedoclimatic conditions. As the C:N ratio of the soil organic matter
does not deviate much from a mean value of 10 gC/gN, the above estimate of the C
sequestration rate (Fig. 7c) can be used to calculate the long-term storage of N in
-1000
0
1000
1850
1900
1950
2000
C sequestr.
ktC/yr
orgC sequest in agricultural soil
1906
N-PdC
L Am
LC
L Av
Pic
M
SM
Gde L
IdF
E
E&L
Br
CO
B
1906
N-PdC
L Am
LC
L Av
Pic
M
SM
Gde L
IdF
E
E&L
Br
CO
B
1906
N-PdC
L Am
LC
L Av
Pic
M
SM
Gde L
IdF
E
E&L
Br
CO
B
2014
N-PdC
L Am
LC
L Av
Pic
M
SM
Gde L
IdF
E
E&L
Br
CO
B
2014
N-PdC
L Am
LC
L Av
Pic
M
SM
Gde L
IdF
E
E&L
Br
CO
B
2014
N-PdC
L Am
LC
L Av
Pic
M
SM
Gde L
IdF
E
E&L
Br
CO
B
0 - 1000
1000-2000
2000-3000
3000-4000
4000-6000
> 6000
CH 4 emission
kgC-CH 4 /km²/yr
N 2 O emission
kgN-N 2 O/km²/yr
<50
50 - 75
75 - 125
125 - 175
175 - 250
> 250
< 1500
1500 - 3000
3000 - 6000
6000 - 12000
12000 - 24000
> 24000
CO 2 emission
kgC-CO 2 /km²/yr
a.
b.
c.
0
1000
2000
3000
4000
5000
1850
1900
1950
2000
emission, k tCeq/yr
CO2
N2O
CH4
greenhouse gas emission, ktCeq/yr
1906
1906
1906
2014
2014
2014
Fig. 7 GHG emissions from the agricultural sector of the Seine basin. (a) Geographical distribution
of CO 2 emissions from fuel combustion (kg C-CO 2 /km
2
/year), N 2 O emissions from cropland and
grassland (kg N-N 2 O/km
2
/year) and CH 4 emissions by livestock (kg C-CH 4 /km
2
/year) in the Seine
basin in 1906 and 2014. (b) Long-term variation of agricultural greenhouse gas emissions from the
Seine basin expressed in C-CO 2 equivalent (ktonC-CO 2 equ/year) (after [35]). (c) Long-term C
sequestration in crop soils [30]
102
G. Billen et al.