

1970-1980
2006-2014
1981-1992
1993-2005
% permanent grassland in total UAA
% legume crop in crop rotations
% spring crop in crop rotations
< 5%
10 - 15%
20 - 25%
30 - 35%
40 - 45%
50 - 55%
60 - 65%
> 75 %
< 1%
2 - 3%
4 - 5%
6 - 7%
8 - 9%
> 10%
< 5%
10 - 15%
20 - 25%
30 - 35%
40 - 45%
> 50%
a.
b.
c.
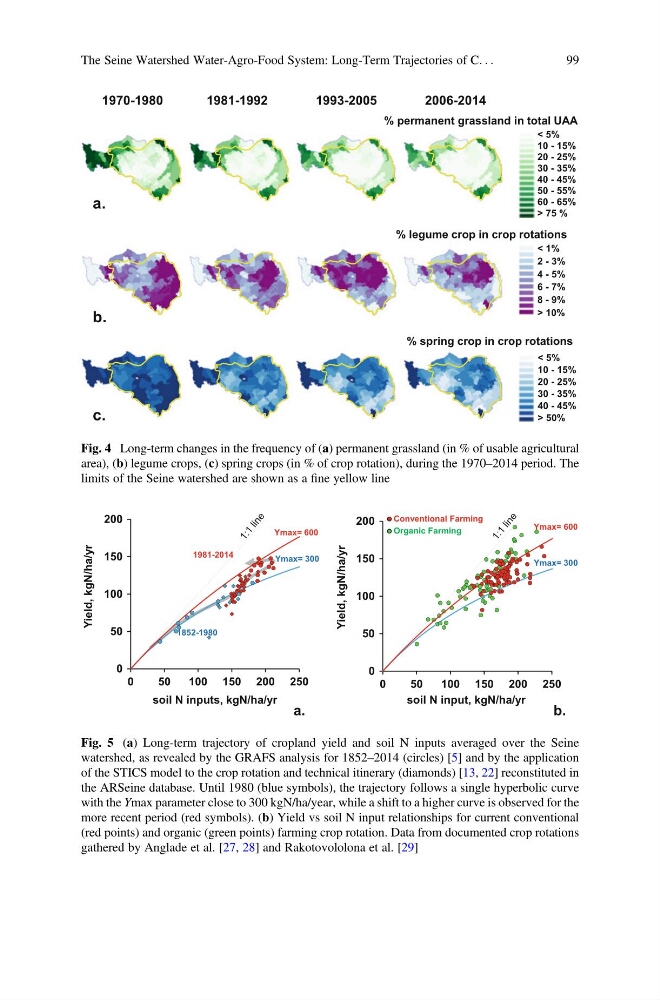
Fig. 4 Long-term changes in the frequency of (a) permanent grassland (in % of usable agricultural
area), (b) legume crops, (c) spring crops (in % of crop rotation), during the 1970–2014 period. The
limits of the Seine watershed are shown as a fine yellow line
0
50
100
150
200
0
50
100 150 200 250
r
y
/
a
h
/
N
g
k
,
d
l
e
i
Y
soil N input, kgN/ha/yr
Ymax= 600
Ymax= 300
a.
b.
1981-2014
1852-1980
Ymax= 600
Ymax= 300
Organic Farming
Conventional Farming
0
50
100
150
200
0
50
100 150 200 250
r
y
/
a
h
/
N
g
k
,
d
l
e
i
Y
soil N inputs, kgN/ha/yr
Fig. 5 (a) Long-term trajectory of cropland yield and soil N inputs averaged over the Seine
watershed, as revealed by the GRAFS analysis for 1852–2014 (circles) [5] and by the application
of the STICS model to the crop rotation and technical itinerary (diamonds) [13, 22] reconstituted in
the ARSeine database. Until 1980 (blue symbols), the trajectory follows a single hyperbolic curve
with the Ymax parameter close to 300 kgN/ha/year, while a shift to a higher curve is observed for the
more recent period (red symbols). (b) Yield vs soil N input relationships for current conventional
(red points) and organic (green points) farming crop rotation. Data from documented crop rotations
gathered by Anglade et al. [27, 28] and Rakotovololona et al. [29]
The Seine Watershed Water-Agro-Food System: Long-Term Trajectories of C. . .
99
2006-2014
1981-1992
1993-2005
% permanent grassland in total UAA
% legume crop in crop rotations
% spring crop in crop rotations
< 5%
10 - 15%
20 - 25%
30 - 35%
40 - 45%
50 - 55%
60 - 65%
> 75 %
< 1%
2 - 3%
4 - 5%
6 - 7%
8 - 9%
> 10%
< 5%
10 - 15%
20 - 25%
30 - 35%
40 - 45%
> 50%
a.
b.
c.
Fig. 4 Long-term changes in the frequency of (a) permanent grassland (in % of usable agricultural
area), (b) legume crops, (c) spring crops (in % of crop rotation), during the 1970–2014 period. The
limits of the Seine watershed are shown as a fine yellow line
0
50
100
150
200
0
50
100 150 200 250
r
y
/
a
h
/
N
g
k
,
d
l
e
i
Y
soil N input, kgN/ha/yr
Ymax= 600
Ymax= 300
a.
b.
1981-2014
1852-1980
Ymax= 600
Ymax= 300
Organic Farming
Conventional Farming
0
50
100
150
200
0
50
100 150 200 250
r
y
/
a
h
/
N
g
k
,
d
l
e
i
Y
soil N inputs, kgN/ha/yr
Fig. 5 (a) Long-term trajectory of cropland yield and soil N inputs averaged over the Seine
watershed, as revealed by the GRAFS analysis for 1852–2014 (circles) [5] and by the application
of the STICS model to the crop rotation and technical itinerary (diamonds) [13, 22] reconstituted in
the ARSeine database. Until 1980 (blue symbols), the trajectory follows a single hyperbolic curve
with the Ymax parameter close to 300 kgN/ha/year, while a shift to a higher curve is observed for the
more recent period (red symbols). (b) Yield vs soil N input relationships for current conventional
(red points) and organic (green points) farming crop rotation. Data from documented crop rotations
gathered by Anglade et al. [27, 28] and Rakotovololona et al. [29]
The Seine Watershed Water-Agro-Food System: Long-Term Trajectories of C. . .
99