

industrial N and P fertilisers, is developed first in the Île-de-France and Eure-et-Loir
regions in the first half of the twentieth century, owing to the proximity of Paris and
transport infrastructures. After World War II, a voluntarist state policy of agriculture
modernisation led to increased farm size, the rural exodus, the rapid increase of
industrial fertiliser use and regional specialisation [24, 25] into either stockless
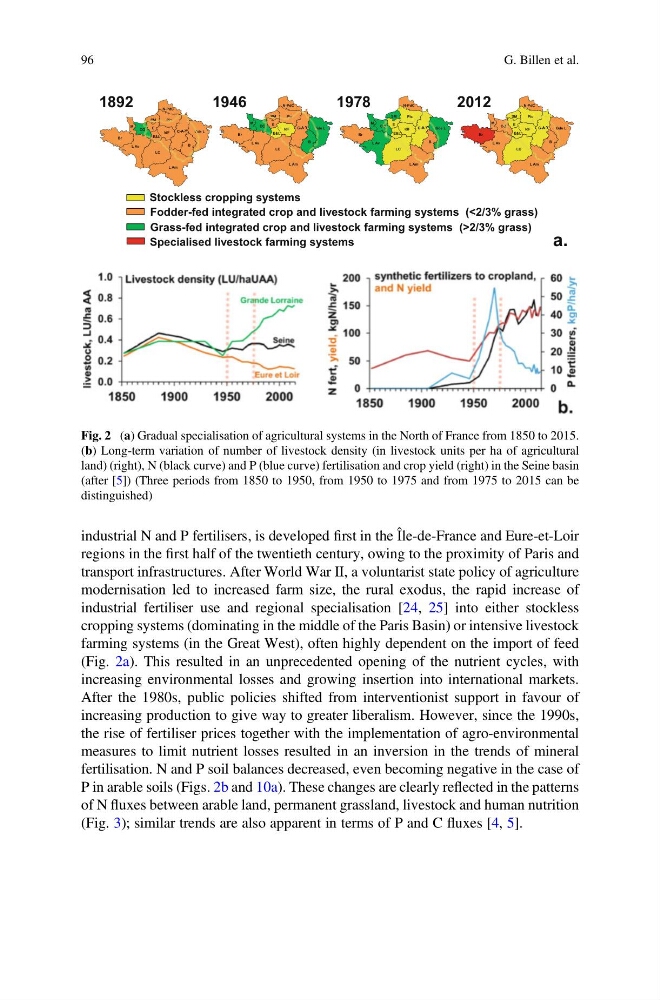
cropping systems (dominating in the middle of the Paris Basin) or intensive livestock
farming systems (in the Great West), often highly dependent on the import of feed
(Fig. 2a). This resulted in an unprecedented opening of the nutrient cycles, with
increasing environmental losses and growing insertion into international markets.
After the 1980s, public policies shifted from interventionist support in favour of
increasing production to give way to greater liberalism. However, since the 1990s,
the rise of fertiliser prices together with the implementation of agro-environmental
measures to limit nutrient losses resulted in an inversion in the trends of mineral
fertilisation. N and P soil balances decreased, even becoming negative in the case of
P in arable soils (Figs. 2b and 10a). These changes are clearly reflected in the patterns
of N fluxes between arable land, permanent grassland, livestock and human nutrition
(Fig. 3); similar trends are also apparent in terms of P and C fluxes [4, 5].
N-PdC
L Am
LC
L Av
Pic
M
SM
Gde L
IdF
E
E&L
Br
CO
B
N-PdC
L Am
LC
L Av
Pic
M
SM
Gde L
IdF
E
E&L
Br
CO
B
N-PdC
L Am
LC
L Av
Pic
M
SM
Gde L
IdF
E
E&L
Br
CO
B
N-PdC
L Am
LC
L Av
Pic
M
SM
Gde L
IdF
E
E&L
Br
CO
B
1892
1946
1978
2012
a.
Specialised livestock farming systems
Stockless cropping systems
Fodder-fed integrated crop and livestock farming systems (<2/3% grass)
Grass-fed integrated crop and livestock farming systems (>2/3% grass)
LC
Pic c
ic c c c c
ic c c c c
Pi ic c c c c
S S S S S S S S S S S S S S S S S S SM M M M M M M M M M M M M M
G G G G G G G G G G G G G G G G G G G G G G G Gde L
IdF
E
E&L L L L
O
B
LC
L Av A A
Pic ic
Pic Pic c c
Pi P Pi ic c c c c c
P P Pic i ic c c
P P c
M
S S S S S S S S S S S S S S S S S S SM M M M M M M M M M
G G G G G G G G G G G G G G G G G G G G G G G Gde L
IdF
E
E&L L L L
Br
CO O O O O O O O O
B
LC
L Av A A
Pic
M
SM
G Gde L
IdF
E
E&L L L L
Br
CO O O O O O O O O O O O O O O O O O O O O O O O
B
LC
L Av A A
Pic
M
SM
G G G Gd
IdF
E
E&L L L L
Br
C C C CO O O O O O O O O O O O O O O O O O O O O
B
Fig. 2 (a) Gradual specialisation of agricultural systems in the North of France from 1850 to 2015.
(b) Long-term variation of number of livestock density (in livestock units per ha of agricultural
land) (right), N (black curve) and P (blue curve) fertilisation and crop yield (right) in the Seine basin
(after [5]) (Three periods from 1850 to 1950, from 1950 to 1975 and from 1975 to 2015 can be
distinguished)
96
G. Billen et al.
regions in the first half of the twentieth century, owing to the proximity of Paris and
transport infrastructures. After World War II, a voluntarist state policy of agriculture
modernisation led to increased farm size, the rural exodus, the rapid increase of
industrial fertiliser use and regional specialisation [24, 25] into either stockless
cropping systems (dominating in the middle of the Paris Basin) or intensive livestock
farming systems (in the Great West), often highly dependent on the import of feed
(Fig. 2a). This resulted in an unprecedented opening of the nutrient cycles, with
increasing environmental losses and growing insertion into international markets.
After the 1980s, public policies shifted from interventionist support in favour of
increasing production to give way to greater liberalism. However, since the 1990s,
the rise of fertiliser prices together with the implementation of agro-environmental
measures to limit nutrient losses resulted in an inversion in the trends of mineral
fertilisation. N and P soil balances decreased, even becoming negative in the case of
P in arable soils (Figs. 2b and 10a). These changes are clearly reflected in the patterns
of N fluxes between arable land, permanent grassland, livestock and human nutrition
(Fig. 3); similar trends are also apparent in terms of P and C fluxes [4, 5].
N-PdC
L Am
LC
L Av
Pic
M
SM
Gde L
IdF
E
E&L
Br
CO
B
N-PdC
L Am
LC
L Av
Pic
M
SM
Gde L
IdF
E
E&L
Br
CO
B
N-PdC
L Am
LC
L Av
Pic
M
SM
Gde L
IdF
E
E&L
Br
CO
B
N-PdC
L Am
LC
L Av
Pic
M
SM
Gde L
IdF
E
E&L
Br
CO
B
1892
1946
1978
2012
a.
Specialised livestock farming systems
Stockless cropping systems
Fodder-fed integrated crop and livestock farming systems (<2/3% grass)
Grass-fed integrated crop and livestock farming systems (>2/3% grass)
LC
Pic c
ic c c c c
ic c c c c
Pi ic c c c c
S S S S S S S S S S S S S S S S S S SM M M M M M M M M M M M M M
G G G G G G G G G G G G G G G G G G G G G G G Gde L
IdF
E
E&L L L L
O
B
LC
L Av A A
Pic ic
Pic Pic c c
Pi P Pi ic c c c c c
P P Pic i ic c c
P P c
M
S S S S S S S S S S S S S S S S S S SM M M M M M M M M M
G G G G G G G G G G G G G G G G G G G G G G G Gde L
IdF
E
E&L L L L
Br
CO O O O O O O O O
B
LC
L Av A A
Pic
M
SM
G Gde L
IdF
E
E&L L L L
Br
CO O O O O O O O O O O O O O O O O O O O O O O O
B
LC
L Av A A
Pic
M
SM
G G G Gd
IdF
E
E&L L L L
Br
C C C CO O O O O O O O O O O O O O O O O O O O O
B
Fig. 2 (a) Gradual specialisation of agricultural systems in the North of France from 1850 to 2015.
(b) Long-term variation of number of livestock density (in livestock units per ha of agricultural
land) (right), N (black curve) and P (blue curve) fertilisation and crop yield (right) in the Seine basin
(after [5]) (Three periods from 1850 to 1950, from 1950 to 1975 and from 1975 to 2015 can be
distinguished)
96
G. Billen et al.