

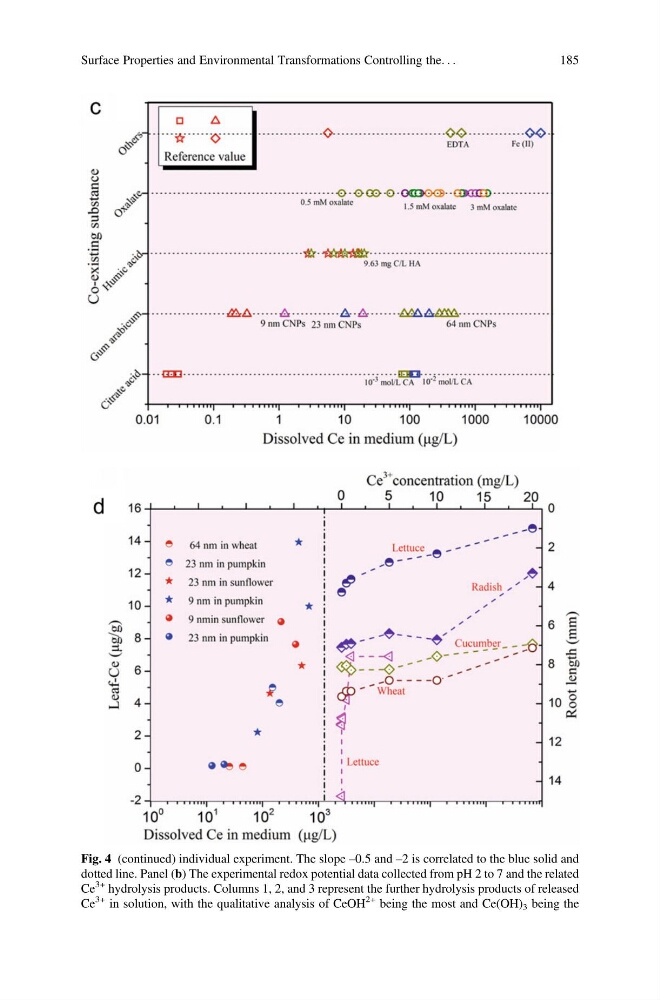
Fig. 4 (continued) individual experiment. The slope –0.5 and –2 is correlated to the blue solid and
dotted line. Panel (b) The experimental redox potential data collected from pH 2 to 7 and the related
Ce
3+ hydrolysis products. Columns 1, 2, and 3 represent the further hydrolysis products of released
Ce
3+ in solution, with the qualitative analysis of CeOH
2+ being the most and Ce(OH) 3 being the
Surface Properties and Environmental Transformations Controlling the. . .
185
dotted line. Panel (b) The experimental redox potential data collected from pH 2 to 7 and the related
Ce
3+ hydrolysis products. Columns 1, 2, and 3 represent the further hydrolysis products of released
Ce
3+ in solution, with the qualitative analysis of CeOH
2+ being the most and Ce(OH) 3 being the
Surface Properties and Environmental Transformations Controlling the. . .
185