

for Cd and Cr. The values of THQ and integrated risk (HI) were not higher than limit
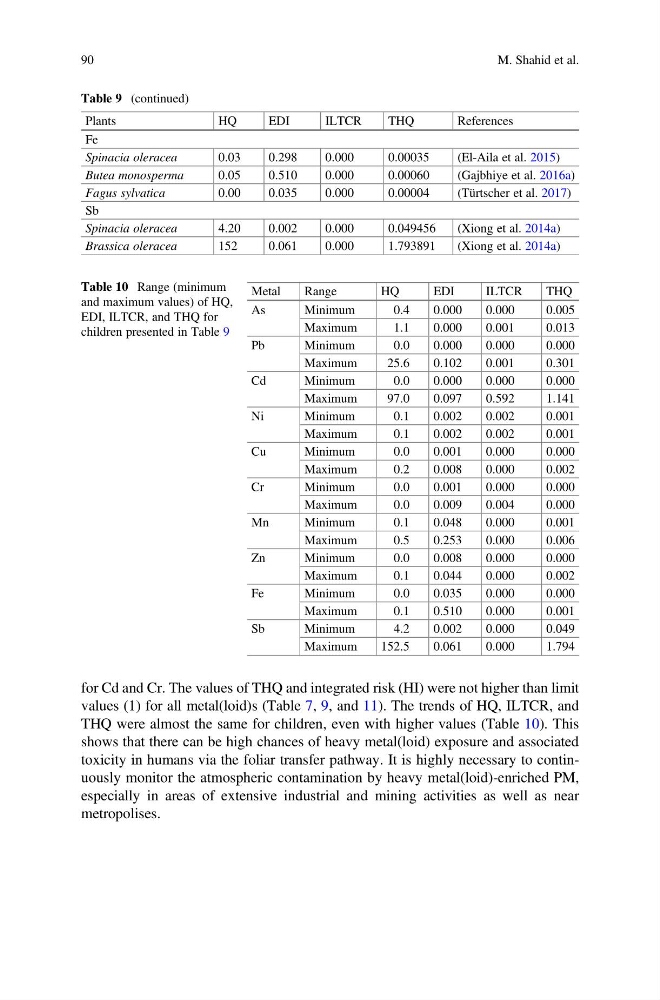
values (1) for all metal(loid)s (Table 7, 9, and 11). The trends of HQ, ILTCR, and
THQ were almost the same for children, even with higher values (Table 10). This
shows that there can be high chances of heavy metal(loid) exposure and associated
toxicity in humans via the foliar transfer pathway. It is highly necessary to continuously monitor the atmospheric contamination by heavy metal(loid)-enriched PM,
especially in areas of extensive industrial and mining activities as well as near
metropolises.
Table 9 (continued)
Plants
HQ
EDI
ILTCR
THQ
References
Fe
Spinacia oleracea
0.03
0.298
0.000
0.00035
(El-Aila et al. 2015)
Butea monosperma
0.05
0.510
0.000
0.00060
(Gajbhiye et al. 2016a)
Fagus sylvatica
0.00
0.035
0.000
0.00004
(Türtscher et al. 2017)
Sb
Spinacia oleracea
4.20
0.002
0.000
0.049456
(Xiong et al. 2014a)
Brassica oleracea
152
0.061
0.000
1.793891
(Xiong et al. 2014a)
Table 10 Range (minimum
and maximum values) of HQ,
EDI, ILTCR, and THQ for
children presented in Table 9
Metal
Range
HQ
EDI
ILTCR
THQ
As
Minimum
0.4
0.000
0.000
0.005
Maximum
1.1
0.000
0.001
0.013
Pb
Minimum
0.0
0.000
0.000
0.000
Maximum
25.6
0.102
0.001
0.301
Cd
Minimum
0.0
0.000
0.000
0.000
Maximum
97.0
0.097
0.592
1.141
Ni
Minimum
0.1
0.002
0.002
0.001
Maximum
0.1
0.002
0.002
0.001
Cu
Minimum
0.0
0.001
0.000
0.000
Maximum
0.2
0.008
0.000
0.002
Cr
Minimum
0.0
0.001
0.000
0.000
Maximum
0.0
0.009
0.004
0.000
Mn
Minimum
0.1
0.048
0.000
0.001
Maximum
0.5
0.253
0.000
0.006
Zn
Minimum
0.0
0.008
0.000
0.000
Maximum
0.1
0.044
0.000
0.002
Fe
Minimum
0.0
0.035
0.000
0.000
Maximum
0.1
0.510
0.000
0.001
Sb
Minimum
4.2
0.002
0.000
0.049
Maximum
152.5
0.061
0.000
1.794
90
M. Shahid et al.
values (1) for all metal(loid)s (Table 7, 9, and 11). The trends of HQ, ILTCR, and
THQ were almost the same for children, even with higher values (Table 10). This
shows that there can be high chances of heavy metal(loid) exposure and associated
toxicity in humans via the foliar transfer pathway. It is highly necessary to continuously monitor the atmospheric contamination by heavy metal(loid)-enriched PM,
especially in areas of extensive industrial and mining activities as well as near
metropolises.
Table 9 (continued)
Plants
HQ
EDI
ILTCR
THQ
References
Fe
Spinacia oleracea
0.03
0.298
0.000
0.00035
(El-Aila et al. 2015)
Butea monosperma
0.05
0.510
0.000
0.00060
(Gajbhiye et al. 2016a)
Fagus sylvatica
0.00
0.035
0.000
0.00004
(Türtscher et al. 2017)
Sb
Spinacia oleracea
4.20
0.002
0.000
0.049456
(Xiong et al. 2014a)
Brassica oleracea
152
0.061
0.000
1.793891
(Xiong et al. 2014a)
Table 10 Range (minimum
and maximum values) of HQ,
EDI, ILTCR, and THQ for
children presented in Table 9
Metal
Range
HQ
EDI
ILTCR
THQ
As
Minimum
0.4
0.000
0.000
0.005
Maximum
1.1
0.000
0.001
0.013
Pb
Minimum
0.0
0.000
0.000
0.000
Maximum
25.6
0.102
0.001
0.301
Cd
Minimum
0.0
0.000
0.000
0.000
Maximum
97.0
0.097
0.592
1.141
Ni
Minimum
0.1
0.002
0.002
0.001
Maximum
0.1
0.002
0.002
0.001
Cu
Minimum
0.0
0.001
0.000
0.000
Maximum
0.2
0.008
0.000
0.002
Cr
Minimum
0.0
0.001
0.000
0.000
Maximum
0.0
0.009
0.004
0.000
Mn
Minimum
0.1
0.048
0.000
0.001
Maximum
0.5
0.253
0.000
0.006
Zn
Minimum
0.0
0.008
0.000
0.000
Maximum
0.1
0.044
0.000
0.002
Fe
Minimum
0.0
0.035
0.000
0.000
Maximum
0.1
0.510
0.000
0.001
Sb
Minimum
4.2
0.002
0.000
0.049
Maximum
152.5
0.061
0.000
1.794
90
M. Shahid et al.