

MATERIELS AND METHODS
Assessment of the
anthropogenic pressures
A: Two visual
approches
Google Earth image:
- Distance from pressures
- Land use over 10Km X
10Km squares
Thematic map with
distances and land use
Type of pressure
(High, Moderate,
Low)
Google Earth image:
- Distance from pressures
-Land use only on the
coastline in 10Km
squares
B: Three quantitative
approches
Data Census with
urban surface only in
10Km square
Integrated exposure
index
Data census with
urban surface of the
minicipality
Data census with
urban surface of the
minicipality
Pressure quotation
PREI
Ecological
Quality
Ratio
Inputs
l
l
Outputs
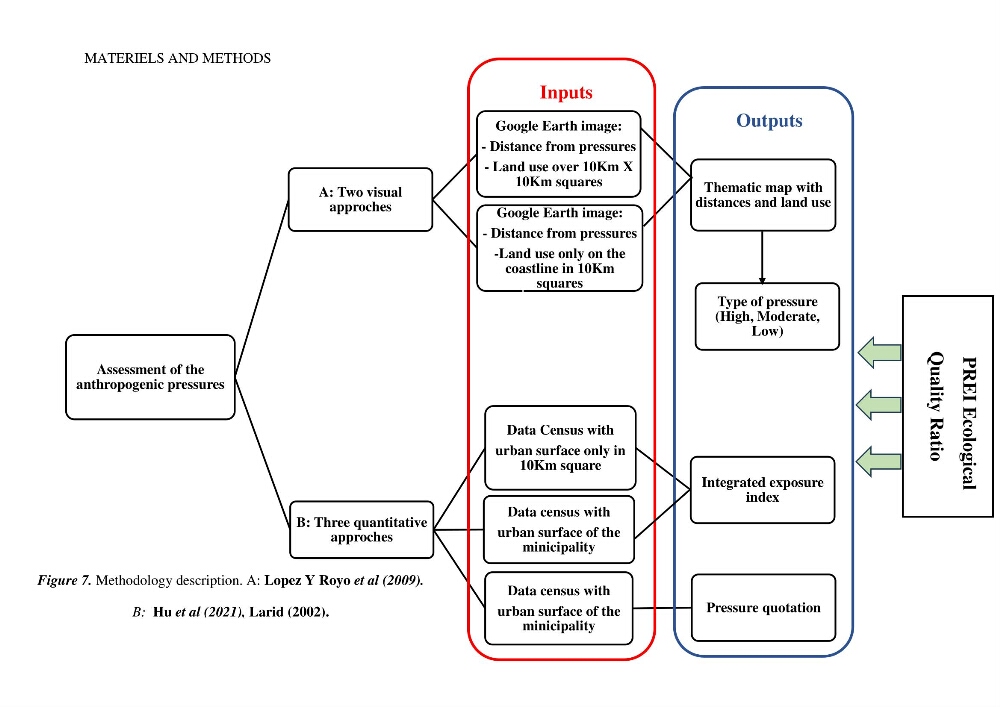
Figure 7. Methodology description. A: Lopez Y Royo et al (2009).
B: Hu et al (2021), Larid (2002).
Assessment of the
anthropogenic pressures
A: Two visual
approches
Google Earth image:
- Distance from pressures
- Land use over 10Km X
10Km squares
Thematic map with
distances and land use
Type of pressure
(High, Moderate,
Low)
Google Earth image:
- Distance from pressures
-Land use only on the
coastline in 10Km
squares
B: Three quantitative
approches
Data Census with
urban surface only in
10Km square
Integrated exposure
index
Data census with
urban surface of the
minicipality
Data census with
urban surface of the
minicipality
Pressure quotation
PREI
Ecological
Quality
Ratio
Inputs
l
l
Outputs
Figure 7. Methodology description. A: Lopez Y Royo et al (2009).
B: Hu et al (2021), Larid (2002).