

MATERIELS AND METHODS
(i) The percentage of urbanization only in the 10km square area.
(ii) The percentage of urbanization considering the entire municipal area.
The estimation of the urbanization was carried out using satellite imagery from Google
Earth pro as described above (§2.2.1).
• Step 1: data collection
Bibliographic research was conducted using governmental websites, Google Scholar, Google
Earth pro, Science Direct and Springer Link, ... In addition, we checked several lists of all studies
retrieved to identify all relevant primary researches published in other peer reviewed journals,
books, reports, and proceedings of international conferences to find numerical values of studied
pressures (for 2018).
We also visited various administrative bodies and ministries to request missing data, such
as: the Ministry of Fisheries, the Ministry of the Environment, the National Statistics Office,
the Water Resources Ministry and its local Directorates and the National Water Resources
Agency.
• Step2: Integrated exposure index calculation
An integrated exposure index was calculated to estimate the total exposure to facilitate
calculation and comparison.
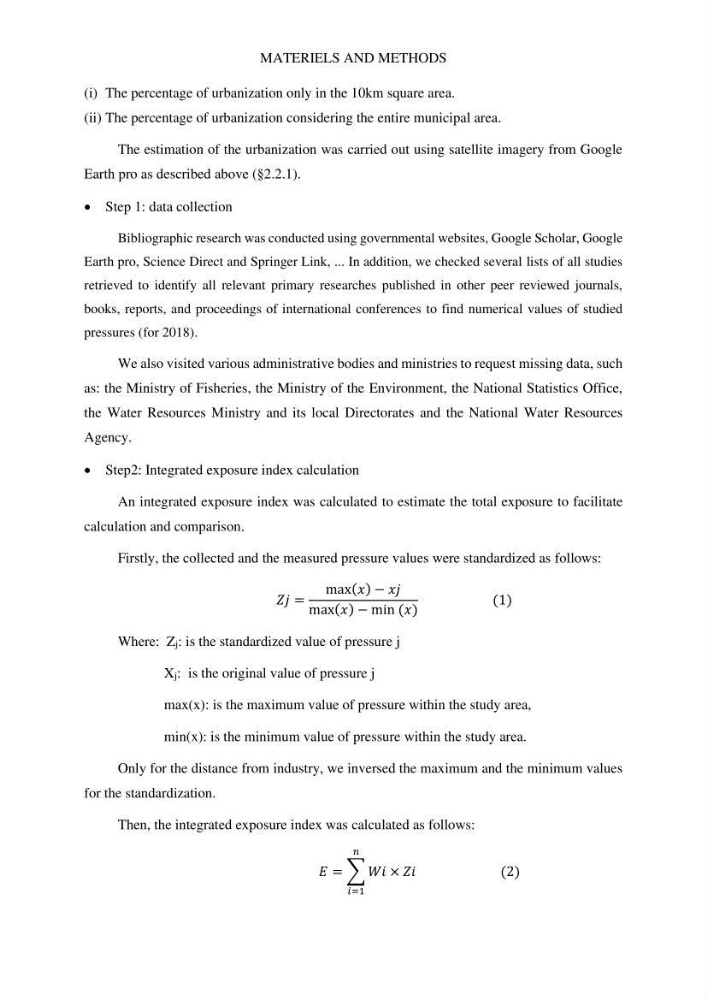
Firstly, the collected and the measured pressure values were standardized as follows:
í µí±í µí± =
max(í µí±¥) − í µí±¥í µí±
max(í µí±¥) − min (í µí±¥)
(1)
Where: Zj: is the standardized value of pressure j
Xj: is the original value of pressure j
max(x): is the maximum value of pressure within the study area,
min(x): is the minimum value of pressure within the study area.
Only for the distance from industry, we inversed the maximum and the minimum values
for the standardization.
Then, the integrated exposure index was calculated as follows:
í µí°¸ = ∑ í µí±í µí± × í µí±í µí±
í µí±
í µí±=1
(2)
(i) The percentage of urbanization only in the 10km square area.
(ii) The percentage of urbanization considering the entire municipal area.
The estimation of the urbanization was carried out using satellite imagery from Google
Earth pro as described above (§2.2.1).
• Step 1: data collection
Bibliographic research was conducted using governmental websites, Google Scholar, Google
Earth pro, Science Direct and Springer Link, ... In addition, we checked several lists of all studies
retrieved to identify all relevant primary researches published in other peer reviewed journals,
books, reports, and proceedings of international conferences to find numerical values of studied
pressures (for 2018).
We also visited various administrative bodies and ministries to request missing data, such
as: the Ministry of Fisheries, the Ministry of the Environment, the National Statistics Office,
the Water Resources Ministry and its local Directorates and the National Water Resources
Agency.
• Step2: Integrated exposure index calculation
An integrated exposure index was calculated to estimate the total exposure to facilitate
calculation and comparison.
Firstly, the collected and the measured pressure values were standardized as follows:
í µí±í µí± =
max(í µí±¥) − í µí±¥í µí±
max(í µí±¥) − min (í µí±¥)
(1)
Where: Zj: is the standardized value of pressure j
Xj: is the original value of pressure j
max(x): is the maximum value of pressure within the study area,
min(x): is the minimum value of pressure within the study area.
Only for the distance from industry, we inversed the maximum and the minimum values
for the standardization.
Then, the integrated exposure index was calculated as follows:
í µí°¸ = ∑ í µí±í µí± × í µí±í µí±
í µí±
í µí±=1
(2)