

lake located about 100 km northwest of Nairobi
(Njuguna 1988; Verschuren 1999) and about
3 km from the main Lake Naivasha. Although
the Lake is fully independent of the main Lake
Naivasha, its levels are believed to oscillate in
harmony with the main lake as a result of
groundwater connection (Mavuti and Harper
2006). The lake’s catchment is pristine. Unlike
the surrounding catchment of the larger Lake
Naivasha, clearance of natural vegetation is significantly limited, thus the sedimentation is
probably very low.
In the Ruiru Reservoir, this study generated
information about the reservoir that is critical for
management but was missing before the study.
Past undated records available show that the
volume was 2,980,000 m
3 , but this information
was not sufficient for the management of the
reservoir and water supply monitoring. However,
sediment assessment showed information on
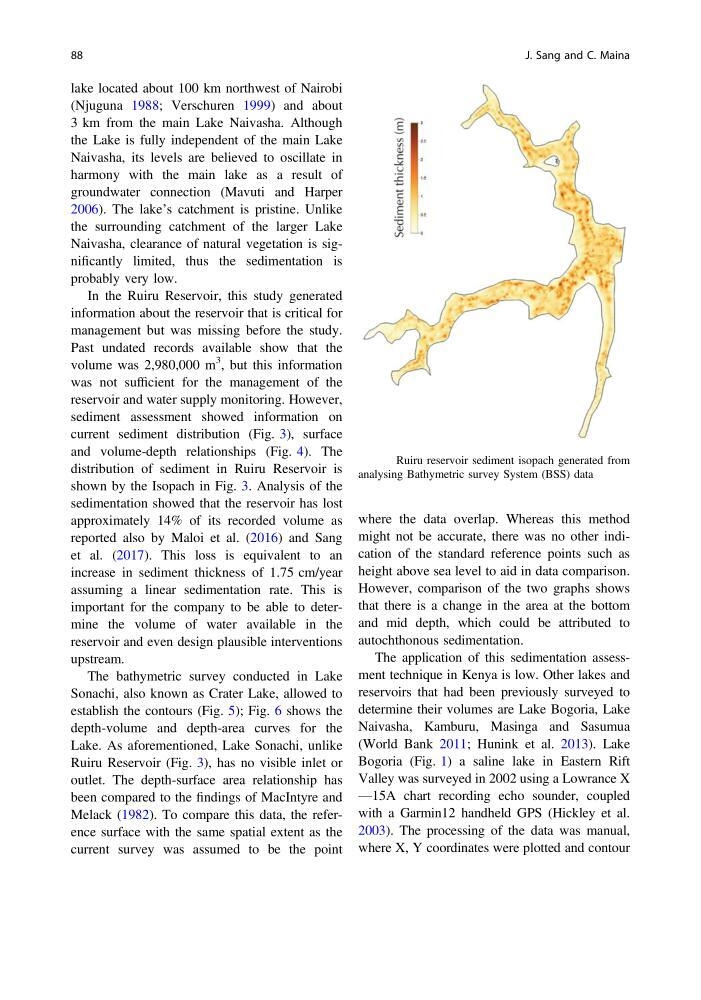
current sediment distribution (Fig. 3), surface
and volume-depth relationships (Fig. 4). The
distribution of sediment in Ruiru Reservoir is
shown by the Isopach in Fig. 3. Analysis of the
sedimentation showed that the reservoir has lost
approximately 14% of its recorded volume as
reported also by Maloi et al. (2016) and Sang
et al. (2017). This loss is equivalent to an
increase in sediment thickness of 1.75 cm/year
assuming a linear sedimentation rate. This is
important for the company to be able to determine the volume of water available in the
reservoir and even design plausible interventions
upstream.
The bathymetric survey conducted in Lake
Sonachi, also known as Crater Lake, allowed to
establish the contours (Fig. 5); Fig. 6 shows the
depth-volume and depth-area curves for the
Lake. As aforementioned, Lake Sonachi, unlike
Ruiru Reservoir (Fig. 3), has no visible inlet or
outlet. The depth-surface area relationship has
been compared to the findings of MacIntyre and
Melack (1982). To compare this data, the reference surface with the same spatial extent as the
current survey was assumed to be the point
where the data overlap. Whereas this method
might not be accurate, there was no other indication of the standard reference points such as
height above sea level to aid in data comparison.
However, comparison of the two graphs shows
that there is a change in the area at the bottom
and mid depth, which could be attributed to
autochthonous sedimentation.
The application of this sedimentation assessment technique in Kenya is low. Other lakes and
reservoirs that had been previously surveyed to
determine their volumes are Lake Bogoria, Lake
Naivasha, Kamburu, Masinga and Sasumua
(World Bank 2011; Hunink et al. 2013). Lake
Bogoria (Fig. 1) a saline lake in Eastern Rift
Valley was surveyed in 2002 using a Lowrance X
—15A chart recording echo sounder, coupled
with a Garmin12 handheld GPS (Hickley et al.
2003). The processing of the data was manual,
where X, Y coordinates were plotted and contour
Fig. 3 Ruiru reservoir sediment isopach generated from
analysing Bathymetric survey System (BSS) data
88
J. Sang and C. Maina
(Njuguna 1988; Verschuren 1999) and about
3 km from the main Lake Naivasha. Although
the Lake is fully independent of the main Lake
Naivasha, its levels are believed to oscillate in
harmony with the main lake as a result of
groundwater connection (Mavuti and Harper
2006). The lake’s catchment is pristine. Unlike
the surrounding catchment of the larger Lake
Naivasha, clearance of natural vegetation is significantly limited, thus the sedimentation is
probably very low.
In the Ruiru Reservoir, this study generated
information about the reservoir that is critical for
management but was missing before the study.
Past undated records available show that the
volume was 2,980,000 m
3 , but this information
was not sufficient for the management of the
reservoir and water supply monitoring. However,
sediment assessment showed information on
current sediment distribution (Fig. 3), surface
and volume-depth relationships (Fig. 4). The
distribution of sediment in Ruiru Reservoir is
shown by the Isopach in Fig. 3. Analysis of the
sedimentation showed that the reservoir has lost
approximately 14% of its recorded volume as
reported also by Maloi et al. (2016) and Sang
et al. (2017). This loss is equivalent to an
increase in sediment thickness of 1.75 cm/year
assuming a linear sedimentation rate. This is
important for the company to be able to determine the volume of water available in the
reservoir and even design plausible interventions
upstream.
The bathymetric survey conducted in Lake
Sonachi, also known as Crater Lake, allowed to
establish the contours (Fig. 5); Fig. 6 shows the
depth-volume and depth-area curves for the
Lake. As aforementioned, Lake Sonachi, unlike
Ruiru Reservoir (Fig. 3), has no visible inlet or
outlet. The depth-surface area relationship has
been compared to the findings of MacIntyre and
Melack (1982). To compare this data, the reference surface with the same spatial extent as the
current survey was assumed to be the point
where the data overlap. Whereas this method
might not be accurate, there was no other indication of the standard reference points such as
height above sea level to aid in data comparison.
However, comparison of the two graphs shows
that there is a change in the area at the bottom
and mid depth, which could be attributed to
autochthonous sedimentation.
The application of this sedimentation assessment technique in Kenya is low. Other lakes and
reservoirs that had been previously surveyed to
determine their volumes are Lake Bogoria, Lake
Naivasha, Kamburu, Masinga and Sasumua
(World Bank 2011; Hunink et al. 2013). Lake
Bogoria (Fig. 1) a saline lake in Eastern Rift
Valley was surveyed in 2002 using a Lowrance X
—15A chart recording echo sounder, coupled
with a Garmin12 handheld GPS (Hickley et al.
2003). The processing of the data was manual,
where X, Y coordinates were plotted and contour
Fig. 3 Ruiru reservoir sediment isopach generated from
analysing Bathymetric survey System (BSS) data
88
J. Sang and C. Maina