

to the reservoirs’ water volume. Overall, the
reservoirs appear to have limited potential for
retaining water, except during years with notably
high or prolonged precipitation.
The model shows limited potential of the
reservoirs and their respective catchments to
harvest rainwater in sufficient quantities between
October and April when most rainfall occurs.
Nonetheless, some rainfall can accumulate during several months. The overflow of reservoir 1A
into reservoir 1B is not to be expected during the
studied period (2010–2016), with all reservoirs
being prone to drying up during the months of
highest evaporation (June–August). The model
represents the limited observations on the ground
well, with a temporal error of plus or minus five
days. Although statistically insignificant, the
2000–2010 decade may have appeared rainier,
with the wet years 2003 and 2010 possibly
having led to a misjudgement for on-farm WH
potential during reservoir planning and implementation. Calibration metrics for infiltration (k 1 )
show high sensitivity in the model, which could
support the assumption that the reservoirs themselves are not sufficiently impervious to infiltration. On the other hand, sensitivity analysis to
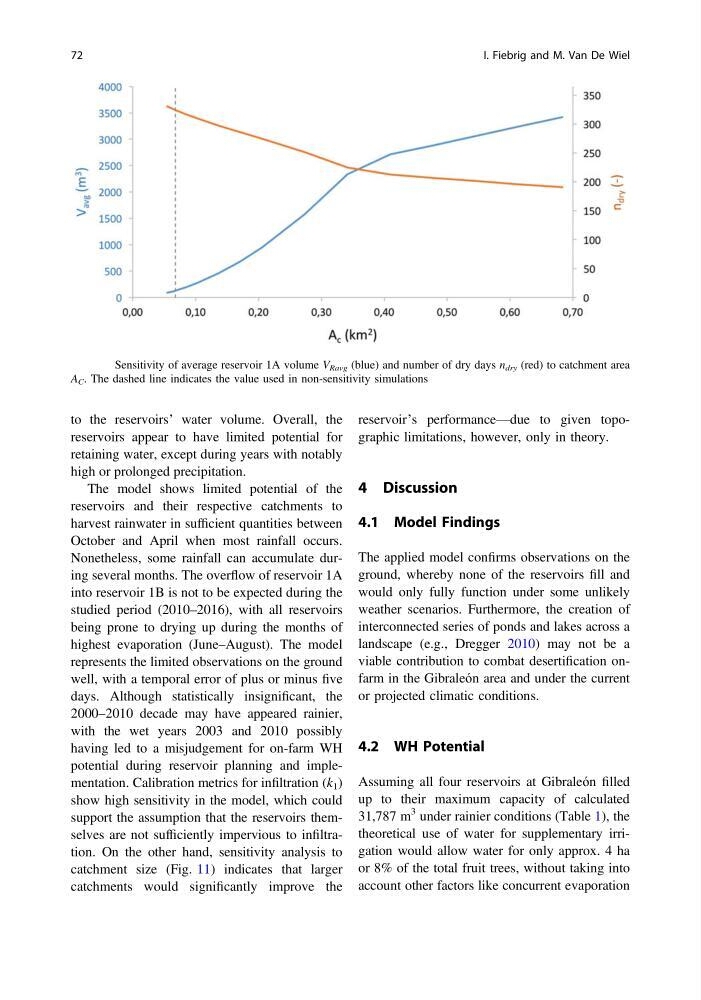
catchment size (Fig. 11) indicates that larger
catchments would significantly improve the
reservoir’s performance—due to given topographic limitations, however, only in theory.
4 Discussion
4.1 Model Findings
The applied model confirms observations on the
ground, whereby none of the reservoirs fill and
would only fully function under some unlikely
weather scenarios. Furthermore, the creation of
interconnected series of ponds and lakes across a
landscape (e.g., Dregger 2010) may not be a
viable contribution to combat desertification onfarm in the Gibraleón area and under the current
or projected climatic conditions.
4.2 WH Potential
Assuming all four reservoirs at Gibraleón filled
up to their maximum capacity of calculated
31,787 m
3 under rainier conditions (Table 1), the
theoretical use of water for supplementary irrigation would allow water for only approx. 4 ha
or 8% of the total fruit trees, without taking into
account other factors like concurrent evaporation
Fig. 11 Sensitivity of average reservoir 1A volume V Ravg (blue) and number of dry days n dry (red) to catchment area
A C . The dashed line indicates the value used in non-sensitivity simulations
72
I. Fiebrig and M. Van De Wiel
reservoirs appear to have limited potential for
retaining water, except during years with notably
high or prolonged precipitation.
The model shows limited potential of the
reservoirs and their respective catchments to
harvest rainwater in sufficient quantities between
October and April when most rainfall occurs.
Nonetheless, some rainfall can accumulate during several months. The overflow of reservoir 1A
into reservoir 1B is not to be expected during the
studied period (2010–2016), with all reservoirs
being prone to drying up during the months of
highest evaporation (June–August). The model
represents the limited observations on the ground
well, with a temporal error of plus or minus five
days. Although statistically insignificant, the
2000–2010 decade may have appeared rainier,
with the wet years 2003 and 2010 possibly
having led to a misjudgement for on-farm WH
potential during reservoir planning and implementation. Calibration metrics for infiltration (k 1 )
show high sensitivity in the model, which could
support the assumption that the reservoirs themselves are not sufficiently impervious to infiltration. On the other hand, sensitivity analysis to
catchment size (Fig. 11) indicates that larger
catchments would significantly improve the
reservoir’s performance—due to given topographic limitations, however, only in theory.
4 Discussion
4.1 Model Findings
The applied model confirms observations on the
ground, whereby none of the reservoirs fill and
would only fully function under some unlikely
weather scenarios. Furthermore, the creation of
interconnected series of ponds and lakes across a
landscape (e.g., Dregger 2010) may not be a
viable contribution to combat desertification onfarm in the Gibraleón area and under the current
or projected climatic conditions.
4.2 WH Potential
Assuming all four reservoirs at Gibraleón filled
up to their maximum capacity of calculated
31,787 m
3 under rainier conditions (Table 1), the
theoretical use of water for supplementary irrigation would allow water for only approx. 4 ha
or 8% of the total fruit trees, without taking into
account other factors like concurrent evaporation
Fig. 11 Sensitivity of average reservoir 1A volume V Ravg (blue) and number of dry days n dry (red) to catchment area
A C . The dashed line indicates the value used in non-sensitivity simulations
72
I. Fiebrig and M. Van De Wiel