

modified V
*
R,sim which represents the closest
fit to observed data within a 5-day kernel around
the simulation date: V
*
R,sim,t = V r,sim,t′ , where
t − 5
t′
t + 5. The significantly better
performance on all metrics of the model under
these modified conditions confirms that the model
captures the overall dynamic of the reservoir
volume, albeit with a temporal error of plus or
minus five days (Table 6; Fig. 6b).
3 Results
3.1 Sensitivity Analysis
Two sensitivity analyses are conducted to test the
influence of reservoir input data (A c , A R ) and
model parameters (k 1 , k 2 ). The reference scenario
is the calibrated scenario, i.e. with input data as
per Table 1 and parameter data as per Table 5. To
test sensitivity each input and parameter are
changed individually over a −20% to +20%
range relative to its base value. Outputs are
analysed in terms of average water volume in the
reservoir, V Ravg , in a five-year period (2012–
2016) and number of reservoir dry days, n dry ,
over the same period, as these are relevant
properties for practical reservoir operation. The
sensitivity to the model parameters k 1 and k 2 is
also analysed in terms of the impact on the calibration metrics R
2 , b, E NS . This naïve analysis
provides a first insight in the input data and
parameter sensitivity but excludes the effects of
parameter interaction.
With respect to V Ravg and n dry , the model
shows very high sensitivity to A c , high sensitivity
Table 5 Calibration results for different calibration metrics: Pearson correlation (R
2
), slope of the regression line (b),
Nash–Sutcliffe efficiency (E NS )
Metric
Value
k 1
k 2
R
2
0.514
7.81
a
3.42
a
b
0.707
7.81
a
3.42
a
E NS
0.475
7.81
a
3.81
a Value used in subsequent simulations
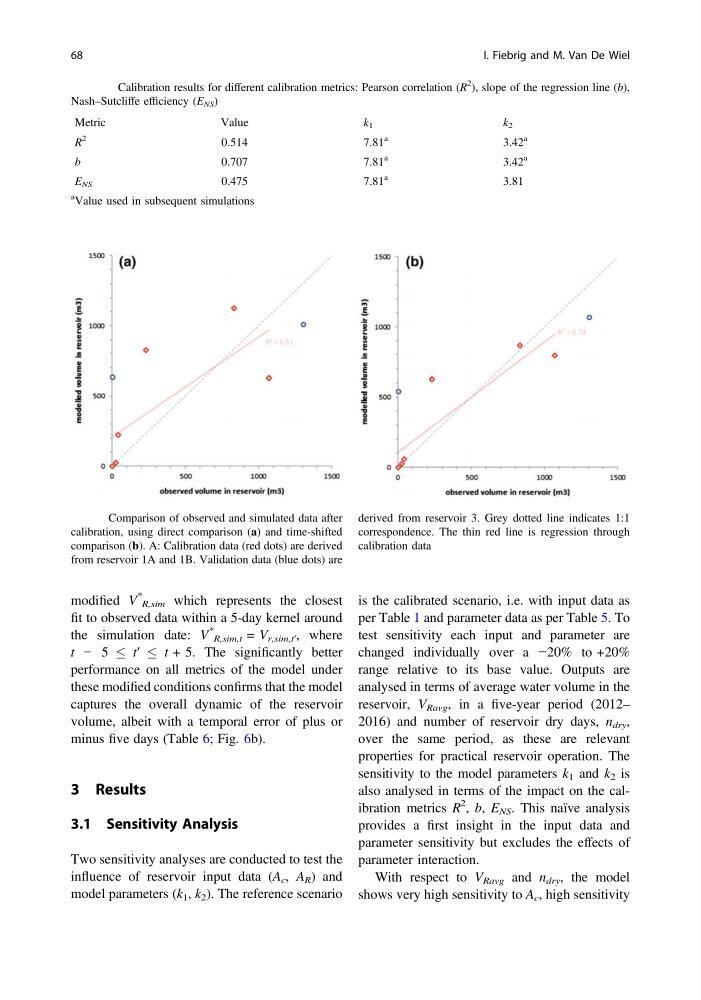
Fig. 6 Comparison of observed and simulated data after
calibration, using direct comparison (a) and time-shifted
comparison (b). A: Calibration data (red dots) are derived
from reservoir 1A and 1B. Validation data (blue dots) are
derived from reservoir 3. Grey dotted line indicates 1:1
correspondence. The thin red line is regression through
calibration data
68
I. Fiebrig and M. Van De Wiel
*
R,sim which represents the closest
fit to observed data within a 5-day kernel around
the simulation date: V
*
R,sim,t = V r,sim,t′ , where
t − 5
t′
t + 5. The significantly better
performance on all metrics of the model under
these modified conditions confirms that the model
captures the overall dynamic of the reservoir
volume, albeit with a temporal error of plus or
minus five days (Table 6; Fig. 6b).
3 Results
3.1 Sensitivity Analysis
Two sensitivity analyses are conducted to test the
influence of reservoir input data (A c , A R ) and
model parameters (k 1 , k 2 ). The reference scenario
is the calibrated scenario, i.e. with input data as
per Table 1 and parameter data as per Table 5. To
test sensitivity each input and parameter are
changed individually over a −20% to +20%
range relative to its base value. Outputs are
analysed in terms of average water volume in the
reservoir, V Ravg , in a five-year period (2012–
2016) and number of reservoir dry days, n dry ,
over the same period, as these are relevant
properties for practical reservoir operation. The
sensitivity to the model parameters k 1 and k 2 is
also analysed in terms of the impact on the calibration metrics R
2 , b, E NS . This naïve analysis
provides a first insight in the input data and
parameter sensitivity but excludes the effects of
parameter interaction.
With respect to V Ravg and n dry , the model
shows very high sensitivity to A c , high sensitivity
Table 5 Calibration results for different calibration metrics: Pearson correlation (R
2
), slope of the regression line (b),
Nash–Sutcliffe efficiency (E NS )
Metric
Value
k 1
k 2
R
2
0.514
7.81
a
3.42
a
b
0.707
7.81
a
3.42
a
E NS
0.475
7.81
a
3.81
a Value used in subsequent simulations
Fig. 6 Comparison of observed and simulated data after
calibration, using direct comparison (a) and time-shifted
comparison (b). A: Calibration data (red dots) are derived
from reservoir 1A and 1B. Validation data (blue dots) are
derived from reservoir 3. Grey dotted line indicates 1:1
correspondence. The thin red line is regression through
calibration data
68
I. Fiebrig and M. Van De Wiel