

the preceding decade. A similar observation holds
for other rainfall characteristics, e.g. maximum
daily rainfall and number of rain days per year
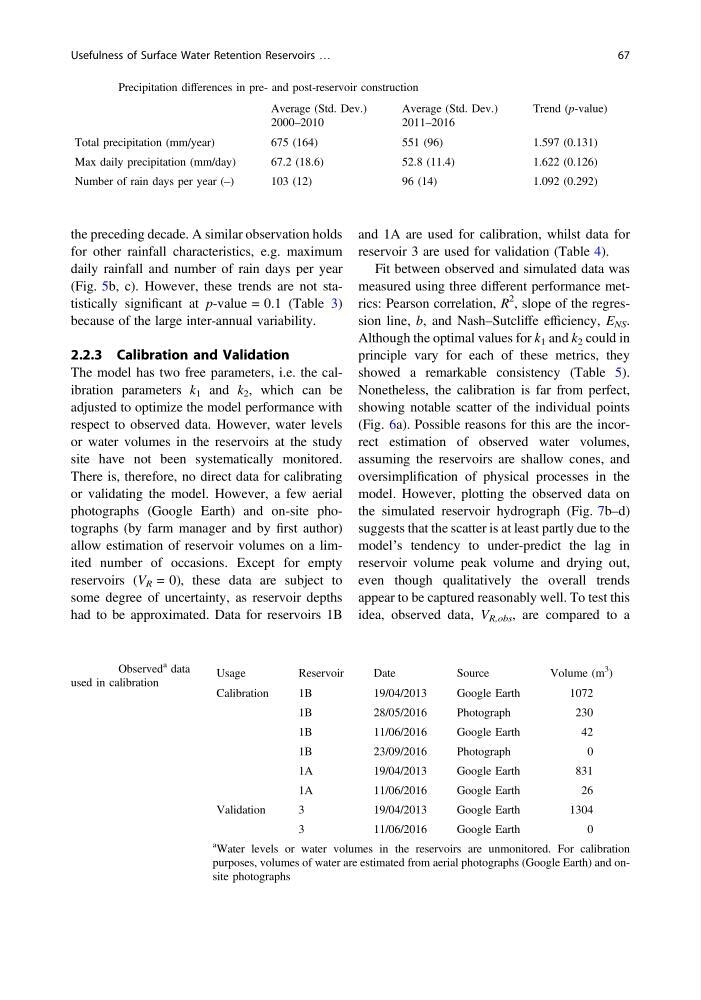
(Fig. 5b, c). However, these trends are not statistically significant at p-value = 0.1 (Table 3)
because of the large inter-annual variability.
2.2.3 Calibration and Validation
The model has two free parameters, i.e. the calibration parameters k 1 and k 2 , which can be
adjusted to optimize the model performance with
respect to observed data. However, water levels
or water volumes in the reservoirs at the study
site have not been systematically monitored.
There is, therefore, no direct data for calibrating
or validating the model. However, a few aerial
photographs (Google Earth) and on-site photographs (by farm manager and by first author)
allow estimation of reservoir volumes on a limited number of occasions. Except for empty
reservoirs (V R = 0), these data are subject to
some degree of uncertainty, as reservoir depths
had to be approximated. Data for reservoirs 1B
and 1A are used for calibration, whilst data for
reservoir 3 are used for validation (Table 4).
Fit between observed and simulated data was
measured using three different performance metrics: Pearson correlation, R
2 , slope of the regression line, b, and Nash–Sutcliffe efficiency, E NS .
Although the optimal values for k 1 and k 2 could in
principle vary for each of these metrics, they
showed a remarkable consistency (Table 5).
Nonetheless, the calibration is far from perfect,
showing notable scatter of the individual points
(Fig. 6a). Possible reasons for this are the incorrect estimation of observed water volumes,
assuming the reservoirs are shallow cones, and
oversimplification of physical processes in the
model. However, plotting the observed data on
the simulated reservoir hydrograph (Fig. 7b–d)
suggests that the scatter is at least partly due to the
model’s tendency to under-predict the lag in
reservoir volume peak volume and drying out,
even though qualitatively the overall trends
appear to be captured reasonably well. To test this
idea, observed data, V R,obs , are compared to a
Table 3 Precipitation differences in pre- and post-reservoir construction
Average (Std. Dev.)
2000–2010
Average (Std. Dev.)
2011–2016
Trend (p-value)
Total precipitation (mm/year)
675 (164)
551 (96)
1.597 (0.131)
Max daily precipitation (mm/day)
67.2 (18.6)
52.8 (11.4)
1.622 (0.126)
Number of rain days per year (–)
103 (12)
96 (14)
1.092 (0.292)
Table 4 Observed
a data
used in calibration
Usage
Reservoir
Date
Source
Volume (m
3
)
Calibration
1B
19/04/2013
Google Earth
1072
1B
28/05/2016
Photograph
230
1B
11/06/2016
Google Earth
42
1B
23/09/2016
Photograph
0
1A
19/04/2013
Google Earth
831
1A
11/06/2016
Google Earth
26
Validation
3
19/04/2013
Google Earth
1304
3
11/06/2016
Google Earth
0
a Water levels or water volumes in the reservoirs are unmonitored. For calibration
purposes, volumes of water are estimated from aerial photographs (Google Earth) and onsite photographs
Usefulness of Surface Water Retention Reservoirs …
67
for other rainfall characteristics, e.g. maximum
daily rainfall and number of rain days per year
(Fig. 5b, c). However, these trends are not statistically significant at p-value = 0.1 (Table 3)
because of the large inter-annual variability.
2.2.3 Calibration and Validation
The model has two free parameters, i.e. the calibration parameters k 1 and k 2 , which can be
adjusted to optimize the model performance with
respect to observed data. However, water levels
or water volumes in the reservoirs at the study
site have not been systematically monitored.
There is, therefore, no direct data for calibrating
or validating the model. However, a few aerial
photographs (Google Earth) and on-site photographs (by farm manager and by first author)
allow estimation of reservoir volumes on a limited number of occasions. Except for empty
reservoirs (V R = 0), these data are subject to
some degree of uncertainty, as reservoir depths
had to be approximated. Data for reservoirs 1B
and 1A are used for calibration, whilst data for
reservoir 3 are used for validation (Table 4).
Fit between observed and simulated data was
measured using three different performance metrics: Pearson correlation, R
2 , slope of the regression line, b, and Nash–Sutcliffe efficiency, E NS .
Although the optimal values for k 1 and k 2 could in
principle vary for each of these metrics, they
showed a remarkable consistency (Table 5).
Nonetheless, the calibration is far from perfect,
showing notable scatter of the individual points
(Fig. 6a). Possible reasons for this are the incorrect estimation of observed water volumes,
assuming the reservoirs are shallow cones, and
oversimplification of physical processes in the
model. However, plotting the observed data on
the simulated reservoir hydrograph (Fig. 7b–d)
suggests that the scatter is at least partly due to the
model’s tendency to under-predict the lag in
reservoir volume peak volume and drying out,
even though qualitatively the overall trends
appear to be captured reasonably well. To test this
idea, observed data, V R,obs , are compared to a
Table 3 Precipitation differences in pre- and post-reservoir construction
Average (Std. Dev.)
2000–2010
Average (Std. Dev.)
2011–2016
Trend (p-value)
Total precipitation (mm/year)
675 (164)
551 (96)
1.597 (0.131)
Max daily precipitation (mm/day)
67.2 (18.6)
52.8 (11.4)
1.622 (0.126)
Number of rain days per year (–)
103 (12)
96 (14)
1.092 (0.292)
Table 4 Observed
a data
used in calibration
Usage
Reservoir
Date
Source
Volume (m
3
)
Calibration
1B
19/04/2013
Google Earth
1072
1B
28/05/2016
Photograph
230
1B
11/06/2016
Google Earth
42
1B
23/09/2016
Photograph
0
1A
19/04/2013
Google Earth
831
1A
11/06/2016
Google Earth
26
Validation
3
19/04/2013
Google Earth
1304
3
11/06/2016
Google Earth
0
a Water levels or water volumes in the reservoirs are unmonitored. For calibration
purposes, volumes of water are estimated from aerial photographs (Google Earth) and onsite photographs
Usefulness of Surface Water Retention Reservoirs …
67