

the physical environment including the implemented watershed management practices. Formal
and informal discussions were arranged to discuss the impacts, challenges, and opportunities
for the introduction, implementation, and adoption of watershed management interventions with
regard to the nexus approach with 80 farmers and
12 development agents (DAs). The 80 farmers
(20 from each watershed) were selected using
simple random sampling, whereas all three DAs
from each watershed were included in the discussions during the data collection about
impacts, opportunities, and challenges of watershed management interventions. The data collected from these discussions were used to
triangulate information extracted from the existing literature. The gender proportion of the
farmers involved in the discussions was 87%
male and 13% female. Of the 12 DAs involved in
the discussions, 75% were male and 25% were
female. The reference decade for assessing the
implemented interventions in most watersheds of
the Tigray region by most researchers was the
2000s because this marked the beginning of the
implementation of programmes focused on
community-based integrated watershed development (Mekonen and Tesfahunegn 2011;
Gebregziabher et al. 2016). In addition, published literature, which has used aerial photographs since 1965 and Landsat images from the
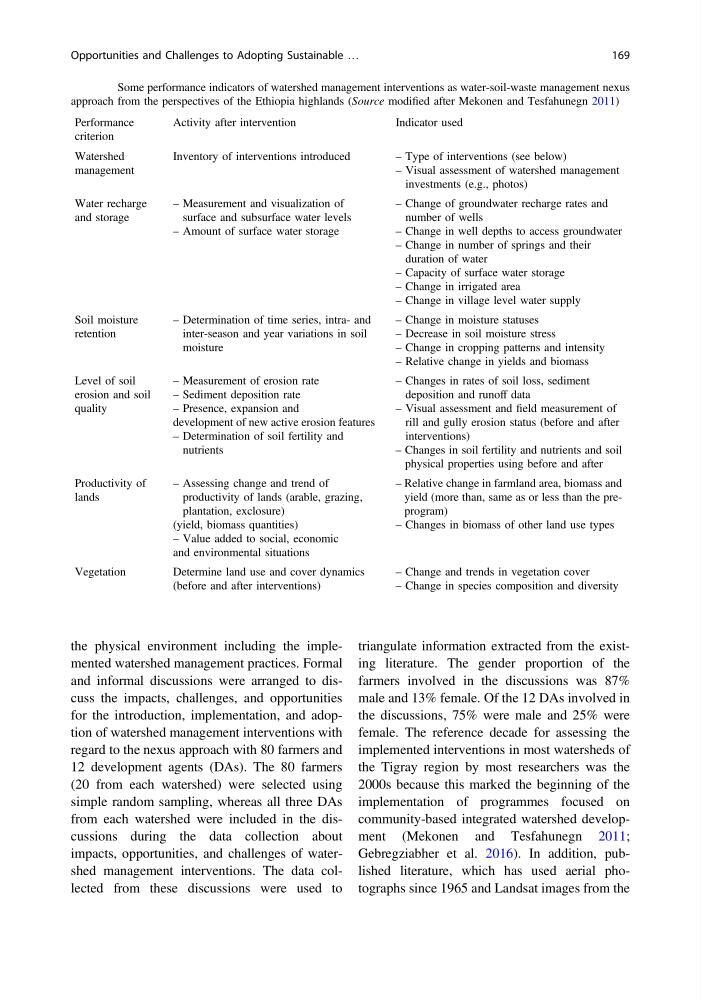
Table 1 Some performance indicators of watershed management interventions as water-soil-waste management nexus
approach from the perspectives of the Ethiopia highlands (Source modified after Mekonen and Tesfahunegn 2011)
Performance
criterion
Activity after intervention
Indicator used
Watershed
management
Inventory of interventions introduced
– Type of interventions (see below)
– Visual assessment of watershed management
investments (e.g., photos)
Water recharge
and storage
– Measurement and visualization of
surface and subsurface water levels
– Amount of surface water storage
– Change of groundwater recharge rates and
number of wells
– Change in well depths to access groundwater
– Change in number of springs and their
duration of water
– Capacity of surface water storage
– Change in irrigated area
– Change in village level water supply
Soil moisture
retention
– Determination of time series, intra- and
inter-season and year variations in soil
moisture
– Change in moisture statuses
– Decrease in soil moisture stress
– Change in cropping patterns and intensity
– Relative change in yields and biomass
Level of soil
erosion and soil
quality
– Measurement of erosion rate
– Sediment deposition rate
– Presence, expansion and
development of new active erosion features
– Determination of soil fertility and
nutrients
– Changes in rates of soil loss, sediment
deposition and runoff data
– Visual assessment and field measurement of
rill and gully erosion status (before and after
interventions)
– Changes in soil fertility and nutrients and soil
physical properties using before and after
Productivity of
lands
– Assessing change and trend of
productivity of lands (arable, grazing,
plantation, exclosure)
(yield, biomass quantities)
– Value added to social, economic
and environmental situations
– Relative change in farmland area, biomass and
yield (more than, same as or less than the preprogram)
– Changes in biomass of other land use types
Vegetation
Determine land use and cover dynamics
(before and after interventions)
– Change and trends in vegetation cover
– Change in species composition and diversity
Opportunities and Challenges to Adopting Sustainable …
169
and informal discussions were arranged to discuss the impacts, challenges, and opportunities
for the introduction, implementation, and adoption of watershed management interventions with
regard to the nexus approach with 80 farmers and
12 development agents (DAs). The 80 farmers
(20 from each watershed) were selected using
simple random sampling, whereas all three DAs
from each watershed were included in the discussions during the data collection about
impacts, opportunities, and challenges of watershed management interventions. The data collected from these discussions were used to
triangulate information extracted from the existing literature. The gender proportion of the
farmers involved in the discussions was 87%
male and 13% female. Of the 12 DAs involved in
the discussions, 75% were male and 25% were
female. The reference decade for assessing the
implemented interventions in most watersheds of
the Tigray region by most researchers was the
2000s because this marked the beginning of the
implementation of programmes focused on
community-based integrated watershed development (Mekonen and Tesfahunegn 2011;
Gebregziabher et al. 2016). In addition, published literature, which has used aerial photographs since 1965 and Landsat images from the
Table 1 Some performance indicators of watershed management interventions as water-soil-waste management nexus
approach from the perspectives of the Ethiopia highlands (Source modified after Mekonen and Tesfahunegn 2011)
Performance
criterion
Activity after intervention
Indicator used
Watershed
management
Inventory of interventions introduced
– Type of interventions (see below)
– Visual assessment of watershed management
investments (e.g., photos)
Water recharge
and storage
– Measurement and visualization of
surface and subsurface water levels
– Amount of surface water storage
– Change of groundwater recharge rates and
number of wells
– Change in well depths to access groundwater
– Change in number of springs and their
duration of water
– Capacity of surface water storage
– Change in irrigated area
– Change in village level water supply
Soil moisture
retention
– Determination of time series, intra- and
inter-season and year variations in soil
moisture
– Change in moisture statuses
– Decrease in soil moisture stress
– Change in cropping patterns and intensity
– Relative change in yields and biomass
Level of soil
erosion and soil
quality
– Measurement of erosion rate
– Sediment deposition rate
– Presence, expansion and
development of new active erosion features
– Determination of soil fertility and
nutrients
– Changes in rates of soil loss, sediment
deposition and runoff data
– Visual assessment and field measurement of
rill and gully erosion status (before and after
interventions)
– Changes in soil fertility and nutrients and soil
physical properties using before and after
Productivity of
lands
– Assessing change and trend of
productivity of lands (arable, grazing,
plantation, exclosure)
(yield, biomass quantities)
– Value added to social, economic
and environmental situations
– Relative change in farmland area, biomass and
yield (more than, same as or less than the preprogram)
– Changes in biomass of other land use types
Vegetation
Determine land use and cover dynamics
(before and after interventions)
– Change and trends in vegetation cover
– Change in species composition and diversity
Opportunities and Challenges to Adopting Sustainable …
169