

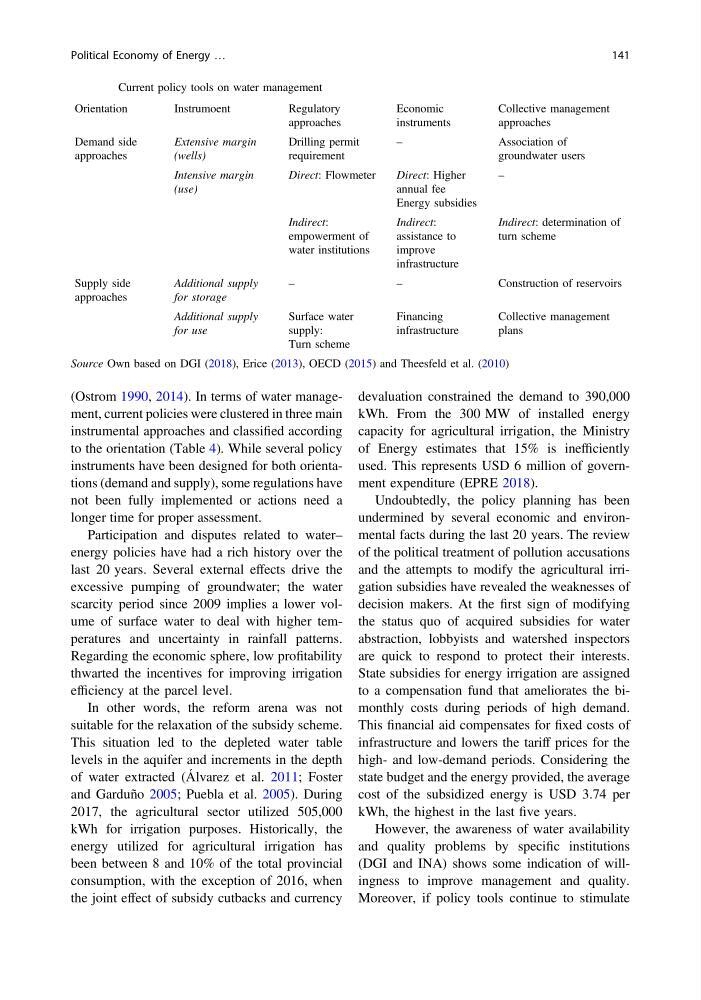
(Ostrom 1990, 2014). In terms of water management, current policies were clustered in three main
instrumental approaches and classified according
to the orientation (Table 4). While several policy
instruments have been designed for both orientations (demand and supply), some regulations have
not been fully implemented or actions need a
longer time for proper assessment.
Participation and disputes related to water–
energy policies have had a rich history over the
last 20 years. Several external effects drive the
excessive pumping of groundwater; the water
scarcity period since 2009 implies a lower volume of surface water to deal with higher temperatures and uncertainty in rainfall patterns.
Regarding the economic sphere, low profitability
thwarted the incentives for improving irrigation
efficiency at the parcel level.
In other words, the reform arena was not
suitable for the relaxation of the subsidy scheme.
This situation led to the depleted water table
levels in the aquifer and increments in the depth
of water extracted (Álvarez et al. 2011; Foster
and Garduño 2005; Puebla et al. 2005). During
2017, the agricultural sector utilized 505,000
kWh for irrigation purposes. Historically, the
energy utilized for agricultural irrigation has
been between 8 and 10% of the total provincial
consumption, with the exception of 2016, when
the joint effect of subsidy cutbacks and currency
devaluation constrained the demand to 390,000
kWh. From the 300 MW of installed energy
capacity for agricultural irrigation, the Ministry
of Energy estimates that 15% is inefficiently
used. This represents USD 6 million of government expenditure (EPRE 2018).
Undoubtedly, the policy planning has been
undermined by several economic and environmental facts during the last 20 years. The review
of the political treatment of pollution accusations
and the attempts to modify the agricultural irrigation subsidies have revealed the weaknesses of
decision makers. At the first sign of modifying
the status quo of acquired subsidies for water
abstraction, lobbyists and watershed inspectors
are quick to respond to protect their interests.
State subsidies for energy irrigation are assigned
to a compensation fund that ameliorates the bimonthly costs during periods of high demand.
This financial aid compensates for fixed costs of
infrastructure and lowers the tariff prices for the
high- and low-demand periods. Considering the
state budget and the energy provided, the average
cost of the subsidized energy is USD 3.74 per
kWh, the highest in the last five years.
However, the awareness of water availability
and quality problems by specific institutions
(DGI and INA) shows some indication of willingness to improve management and quality.
Moreover, if policy tools continue to stimulate
Table 4 Current policy tools on water management
Orientation
Instrumoent
Regulatory
approaches
Economic
instruments
Collective management
approaches
Demand side
approaches
Extensive margin
(wells)
Drilling permit
requirement
–
Association of
groundwater users
Intensive margin
(use)
Direct: Flowmeter
Direct: Higher
annual fee
Energy subsidies
–
Indirect:
empowerment of
water institutions
Indirect:
assistance to
improve
infrastructure
Indirect: determination of
turn scheme
Supply side
approaches
Additional supply
for storage
–
–
Construction of reservoirs
Additional supply
for use
Surface water
supply:
Turn scheme
Financing
infrastructure
Collective management
plans
Source Own based on DGI (2018), Erice (2013), OECD (2015) and Theesfeld et al. (2010)
Political Economy of Energy …
141
instrumental approaches and classified according
to the orientation (Table 4). While several policy
instruments have been designed for both orientations (demand and supply), some regulations have
not been fully implemented or actions need a
longer time for proper assessment.
Participation and disputes related to water–
energy policies have had a rich history over the
last 20 years. Several external effects drive the
excessive pumping of groundwater; the water
scarcity period since 2009 implies a lower volume of surface water to deal with higher temperatures and uncertainty in rainfall patterns.
Regarding the economic sphere, low profitability
thwarted the incentives for improving irrigation
efficiency at the parcel level.
In other words, the reform arena was not
suitable for the relaxation of the subsidy scheme.
This situation led to the depleted water table
levels in the aquifer and increments in the depth
of water extracted (Álvarez et al. 2011; Foster
and Garduño 2005; Puebla et al. 2005). During
2017, the agricultural sector utilized 505,000
kWh for irrigation purposes. Historically, the
energy utilized for agricultural irrigation has
been between 8 and 10% of the total provincial
consumption, with the exception of 2016, when
the joint effect of subsidy cutbacks and currency
devaluation constrained the demand to 390,000
kWh. From the 300 MW of installed energy
capacity for agricultural irrigation, the Ministry
of Energy estimates that 15% is inefficiently
used. This represents USD 6 million of government expenditure (EPRE 2018).
Undoubtedly, the policy planning has been
undermined by several economic and environmental facts during the last 20 years. The review
of the political treatment of pollution accusations
and the attempts to modify the agricultural irrigation subsidies have revealed the weaknesses of
decision makers. At the first sign of modifying
the status quo of acquired subsidies for water
abstraction, lobbyists and watershed inspectors
are quick to respond to protect their interests.
State subsidies for energy irrigation are assigned
to a compensation fund that ameliorates the bimonthly costs during periods of high demand.
This financial aid compensates for fixed costs of
infrastructure and lowers the tariff prices for the
high- and low-demand periods. Considering the
state budget and the energy provided, the average
cost of the subsidized energy is USD 3.74 per
kWh, the highest in the last five years.
However, the awareness of water availability
and quality problems by specific institutions
(DGI and INA) shows some indication of willingness to improve management and quality.
Moreover, if policy tools continue to stimulate
Table 4 Current policy tools on water management
Orientation
Instrumoent
Regulatory
approaches
Economic
instruments
Collective management
approaches
Demand side
approaches
Extensive margin
(wells)
Drilling permit
requirement
–
Association of
groundwater users
Intensive margin
(use)
Direct: Flowmeter
Direct: Higher
annual fee
Energy subsidies
–
Indirect:
empowerment of
water institutions
Indirect:
assistance to
improve
infrastructure
Indirect: determination of
turn scheme
Supply side
approaches
Additional supply
for storage
–
–
Construction of reservoirs
Additional supply
for use
Surface water
supply:
Turn scheme
Financing
infrastructure
Collective management
plans
Source Own based on DGI (2018), Erice (2013), OECD (2015) and Theesfeld et al. (2010)
Political Economy of Energy …
141