

considerably. Soon after the zoning restriction
was issued, the judicial sector enforced a review
of the water quality in surrounding areas.
The INA performed water quality analysis in the
aquifer, confirming that the alarming quality
decrement of irrigation water characterized by
high salinity levels.
In response to political pressure and considering the economic weight of oil refinement for
the provincial GDP, the provincial government
called for new water quality analysis and determined the validity of oil exploitations (Severino
2005). At the same time, fiscal oilfields (YPF,
according to the Spanish name) faced political
and institutional consequences and had to reimburse the damage to most affected farmers. In
2004, DGI ordered YPF damage control actions
and they have worked collaboratively on
groundwater quality and water table level monitoring. Simultaneously, attempts to review for
adjustments with regard to energy tariffs for
agricultural irrigation in the province were neutralized by local legislators. Supported by the
private sector, their argument focused on the
difficult scenario for farmers, in particular for
those solely dependent on groundwater irrigation. Nothing was mentioned about responsible
exploitation or sustainable use of the resource.
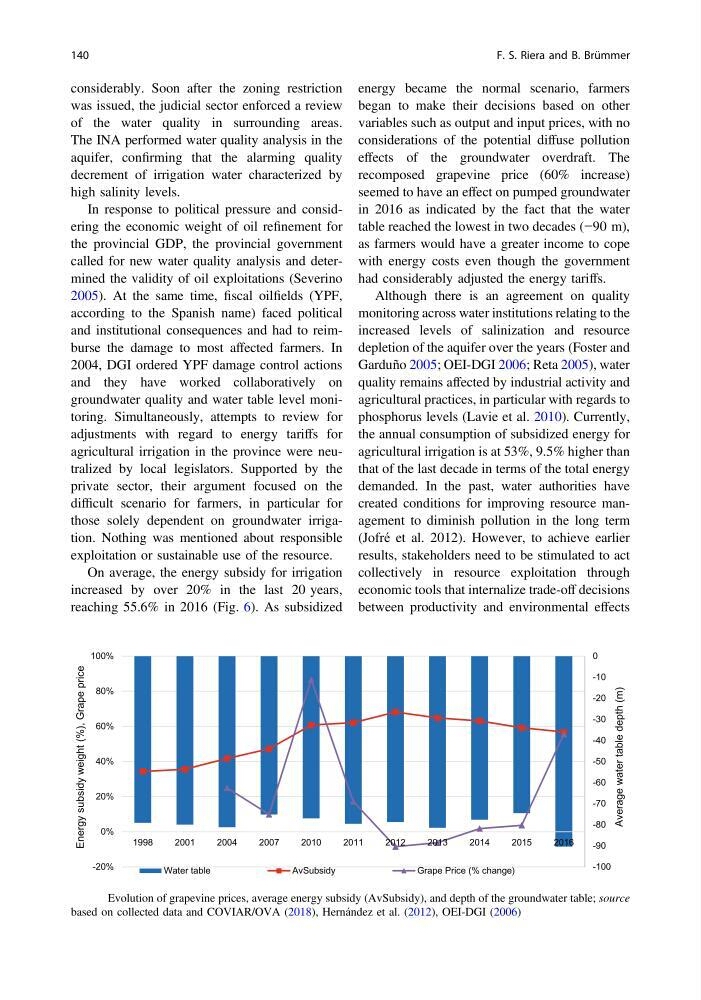
On average, the energy subsidy for irrigation
increased by over 20% in the last 20 years,
reaching 55.6% in 2016 (Fig. 6). As subsidized
energy became the normal scenario, farmers
began to make their decisions based on other
variables such as output and input prices, with no
considerations of the potential diffuse pollution
effects of the groundwater overdraft. The
recomposed grapevine price (60% increase)
seemed to have an effect on pumped groundwater
in 2016 as indicated by the fact that the water
table reached the lowest in two decades (−90 m),
as farmers would have a greater income to cope
with energy costs even though the government
had considerably adjusted the energy tariffs.
Although there is an agreement on quality
monitoring across water institutions relating to the
increased levels of salinization and resource
depletion of the aquifer over the years (Foster and
Garduño 2005; OEI-DGI 2006; Reta 2005), water
quality remains affected by industrial activity and
agricultural practices, in particular with regards to
phosphorus levels (Lavie et al. 2010). Currently,
the annual consumption of subsidized energy for
agricultural irrigation is at 53%, 9.5% higher than
that of the last decade in terms of the total energy
demanded. In the past, water authorities have
created conditions for improving resource management to diminish pollution in the long term
(Jofré et al. 2012). However, to achieve earlier
results, stakeholders need to be stimulated to act
collectively in resource exploitation through
economic tools that internalize trade-off decisions
between productivity and environmental effects
-100
-90
-80
-70
-60
-50
-40
-30
-20
-10
0
-20%
0%
20%
40%
60%
80%
100%
1998
2001
2004
2007
2010
2011
2012
2013
2014
2015
2016
Average water table depth (m)
Energy subsidy weight (%), Grape price
Water table
AvSubsidy
Grape Price (% change)
Fig. 6 Evolution of grapevine prices, average energy subsidy (AvSubsidy), and depth of the groundwater table; source
based on collected data and COVIAR/OVA (2018), Hernández et al. (2012), OEI-DGI (2006)
140
F. S. Riera and B. Brümmer
was issued, the judicial sector enforced a review
of the water quality in surrounding areas.
The INA performed water quality analysis in the
aquifer, confirming that the alarming quality
decrement of irrigation water characterized by
high salinity levels.
In response to political pressure and considering the economic weight of oil refinement for
the provincial GDP, the provincial government
called for new water quality analysis and determined the validity of oil exploitations (Severino
2005). At the same time, fiscal oilfields (YPF,
according to the Spanish name) faced political
and institutional consequences and had to reimburse the damage to most affected farmers. In
2004, DGI ordered YPF damage control actions
and they have worked collaboratively on
groundwater quality and water table level monitoring. Simultaneously, attempts to review for
adjustments with regard to energy tariffs for
agricultural irrigation in the province were neutralized by local legislators. Supported by the
private sector, their argument focused on the
difficult scenario for farmers, in particular for
those solely dependent on groundwater irrigation. Nothing was mentioned about responsible
exploitation or sustainable use of the resource.
On average, the energy subsidy for irrigation
increased by over 20% in the last 20 years,
reaching 55.6% in 2016 (Fig. 6). As subsidized
energy became the normal scenario, farmers
began to make their decisions based on other
variables such as output and input prices, with no
considerations of the potential diffuse pollution
effects of the groundwater overdraft. The
recomposed grapevine price (60% increase)
seemed to have an effect on pumped groundwater
in 2016 as indicated by the fact that the water
table reached the lowest in two decades (−90 m),
as farmers would have a greater income to cope
with energy costs even though the government
had considerably adjusted the energy tariffs.
Although there is an agreement on quality
monitoring across water institutions relating to the
increased levels of salinization and resource
depletion of the aquifer over the years (Foster and
Garduño 2005; OEI-DGI 2006; Reta 2005), water
quality remains affected by industrial activity and
agricultural practices, in particular with regards to
phosphorus levels (Lavie et al. 2010). Currently,
the annual consumption of subsidized energy for
agricultural irrigation is at 53%, 9.5% higher than
that of the last decade in terms of the total energy
demanded. In the past, water authorities have
created conditions for improving resource management to diminish pollution in the long term
(Jofré et al. 2012). However, to achieve earlier
results, stakeholders need to be stimulated to act
collectively in resource exploitation through
economic tools that internalize trade-off decisions
between productivity and environmental effects
-100
-90
-80
-70
-60
-50
-40
-30
-20
-10
0
-20%
0%
20%
40%
60%
80%
100%
1998
2001
2004
2007
2010
2011
2012
2013
2014
2015
2016
Average water table depth (m)
Energy subsidy weight (%), Grape price
Water table
AvSubsidy
Grape Price (% change)
Fig. 6 Evolution of grapevine prices, average energy subsidy (AvSubsidy), and depth of the groundwater table; source
based on collected data and COVIAR/OVA (2018), Hernández et al. (2012), OEI-DGI (2006)
140
F. S. Riera and B. Brümmer