

after the reform, major negative effects due to the
phasing out of subsidies were not found. For
instance, Eskandary et al. (2017) used the input–
output matrix approach with data from 2006 to
2014 and showed that agricultural production
decreased, but the total value of agricultural
products increased by approximately 1.5% as a
result of increased agricultural prices. On the
other hand, Zare-Chahouki and Sanaei (2017)
analyzed available statistics before and after the
reform implementation, finding that the consumption of pesticides and fertilizers decreased
by 87.5 and 55% during the 2009–2013 period.
However, increases in prices for meat, dairy
products, and fodder crops have kept agricultural
production steady and even encouraged overgrazing. They also found a side effect from the
increased fuel prices: rural residents substituted
gas with wood and, as a result, deforestation
increased. In another study from the Urumiyeh
region in northwestern Iran, the effect of the
subsidy reform was analyzed from a socioeconomic point of view (Ahmadi et al. 2016).
The authors conducted a structured survey
among rural residents and used a structural
equation model to analyze their welfare before
and after the subsidy reform. Considering the
lump-sum payments for each household stipulated under the compensation scheme of the price
reform, as well as other socio-economic factors
such as consumption patterns, social conditions,
and saving patterns, the model shows that the
socio-economic conditions of the rural households were improved. The findings suggest that
the price/subsidy reform did not affect rural life
as negatively as was expected. It should be
mentioned that no study up until now has shown
that water extraction changed due to energy price
increases. In sum, it appears that, with minor
increases in agricultural energy prices and major
increases in the prices of food products, there was
not a major reduction in agricultural production
in Iran. In the future, as more data may become
available, it will be possible to analyze the effects
of subsidy cuts in more detail.
4 A Path for the Future
During the years after the reform, the
announcements of the parliament’s agricultural
commission and energy commission showed
how pressure from farmers was transferred to the
parliament via MPs.
21 It is clear that before any
compensatory scheme for farmers to be implemented, changing the energy pricing policy for
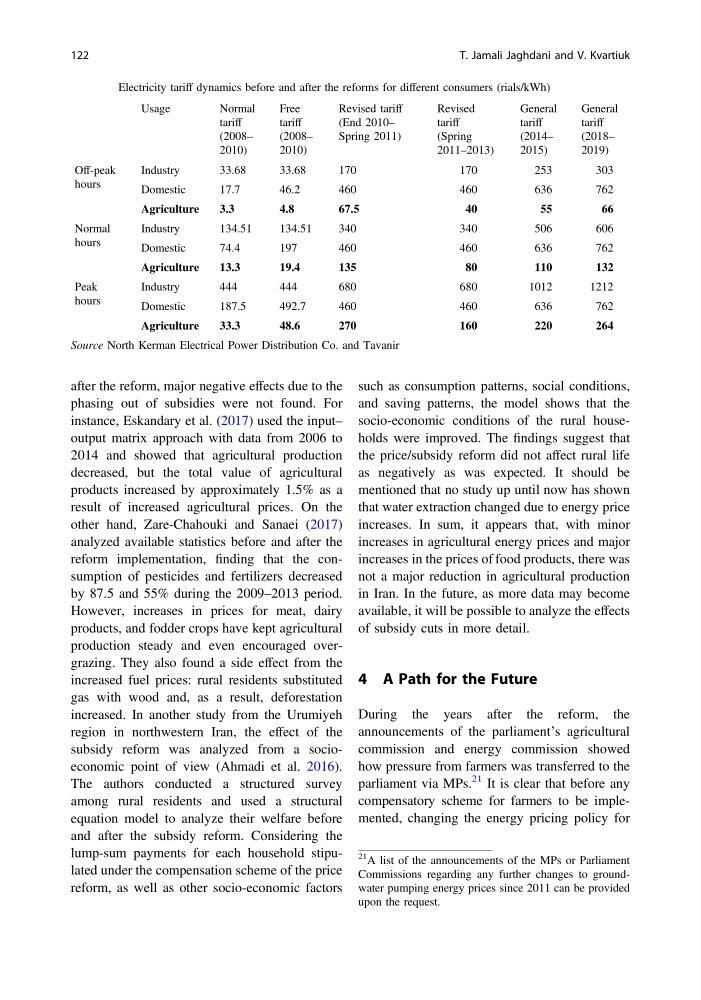
Table 7 Electricity tariff dynamics before and after the reforms for different consumers (rials/kWh)
Usage
Normal
tariff
(2008–
2010)
Free
tariff
(2008–
2010)
Revised tariff
(End 2010–
Spring 2011)
Revised
tariff
(Spring
2011–2013)
General
tariff
(2014–
2015)
General
tariff
(2018–
2019)
Off-peak
hours
Industry
33.68
33.68
170
170
253
303
Domestic
17.7
46.2
460
460
636
762
Agriculture
3.3
4.8
67.5
40
55
66
Normal
hours
Industry
134.51
134.51
340
340
506
606
Domestic
74.4
197
460
460
636
762
Agriculture
13.3
19.4
135
80
110
132
Peak
hours
Industry
444
444
680
680
1012
1212
Domestic
187.5
492.7
460
460
636
762
Agriculture
33.3
48.6
270
160
220
264
Source North Kerman Electrical Power Distribution Co. and Tavanir
21
A list of the announcements of the MPs or Parliament
Commissions regarding any further changes to groundwater pumping energy prices since 2011 can be provided
upon the request.
122
T. Jamali Jaghdani and V. Kvartiuk
phasing out of subsidies were not found. For
instance, Eskandary et al. (2017) used the input–
output matrix approach with data from 2006 to
2014 and showed that agricultural production
decreased, but the total value of agricultural
products increased by approximately 1.5% as a
result of increased agricultural prices. On the
other hand, Zare-Chahouki and Sanaei (2017)
analyzed available statistics before and after the
reform implementation, finding that the consumption of pesticides and fertilizers decreased
by 87.5 and 55% during the 2009–2013 period.
However, increases in prices for meat, dairy
products, and fodder crops have kept agricultural
production steady and even encouraged overgrazing. They also found a side effect from the
increased fuel prices: rural residents substituted
gas with wood and, as a result, deforestation
increased. In another study from the Urumiyeh
region in northwestern Iran, the effect of the
subsidy reform was analyzed from a socioeconomic point of view (Ahmadi et al. 2016).
The authors conducted a structured survey
among rural residents and used a structural
equation model to analyze their welfare before
and after the subsidy reform. Considering the
lump-sum payments for each household stipulated under the compensation scheme of the price
reform, as well as other socio-economic factors
such as consumption patterns, social conditions,
and saving patterns, the model shows that the
socio-economic conditions of the rural households were improved. The findings suggest that
the price/subsidy reform did not affect rural life
as negatively as was expected. It should be
mentioned that no study up until now has shown
that water extraction changed due to energy price
increases. In sum, it appears that, with minor
increases in agricultural energy prices and major
increases in the prices of food products, there was
not a major reduction in agricultural production
in Iran. In the future, as more data may become
available, it will be possible to analyze the effects
of subsidy cuts in more detail.
4 A Path for the Future
During the years after the reform, the
announcements of the parliament’s agricultural
commission and energy commission showed
how pressure from farmers was transferred to the
parliament via MPs.
21 It is clear that before any
compensatory scheme for farmers to be implemented, changing the energy pricing policy for
Table 7 Electricity tariff dynamics before and after the reforms for different consumers (rials/kWh)
Usage
Normal
tariff
(2008–
2010)
Free
tariff
(2008–
2010)
Revised tariff
(End 2010–
Spring 2011)
Revised
tariff
(Spring
2011–2013)
General
tariff
(2014–
2015)
General
tariff
(2018–
2019)
Off-peak
hours
Industry
33.68
33.68
170
170
253
303
Domestic
17.7
46.2
460
460
636
762
Agriculture
3.3
4.8
67.5
40
55
66
Normal
hours
Industry
134.51
134.51
340
340
506
606
Domestic
74.4
197
460
460
636
762
Agriculture
13.3
19.4
135
80
110
132
Peak
hours
Industry
444
444
680
680
1012
1212
Domestic
187.5
492.7
460
460
636
762
Agriculture
33.3
48.6
270
160
220
264
Source North Kerman Electrical Power Distribution Co. and Tavanir
21
A list of the announcements of the MPs or Parliament
Commissions regarding any further changes to groundwater pumping energy prices since 2011 can be provided
upon the request.
122
T. Jamali Jaghdani and V. Kvartiuk