

determining the production function are: the
amount of water discharged or used to drive
turbines and the height of the landfill. However,
as assumed by Aylward (1998) in the absence of
a height effect, the variation in the electricity
production that occurs is a function only of the
variation in the discharge. Any change in the
reservoir over a given period can be directly
translated from units of water (cubic meters) to
units of electricity (kWh) (Aylward 1998). An
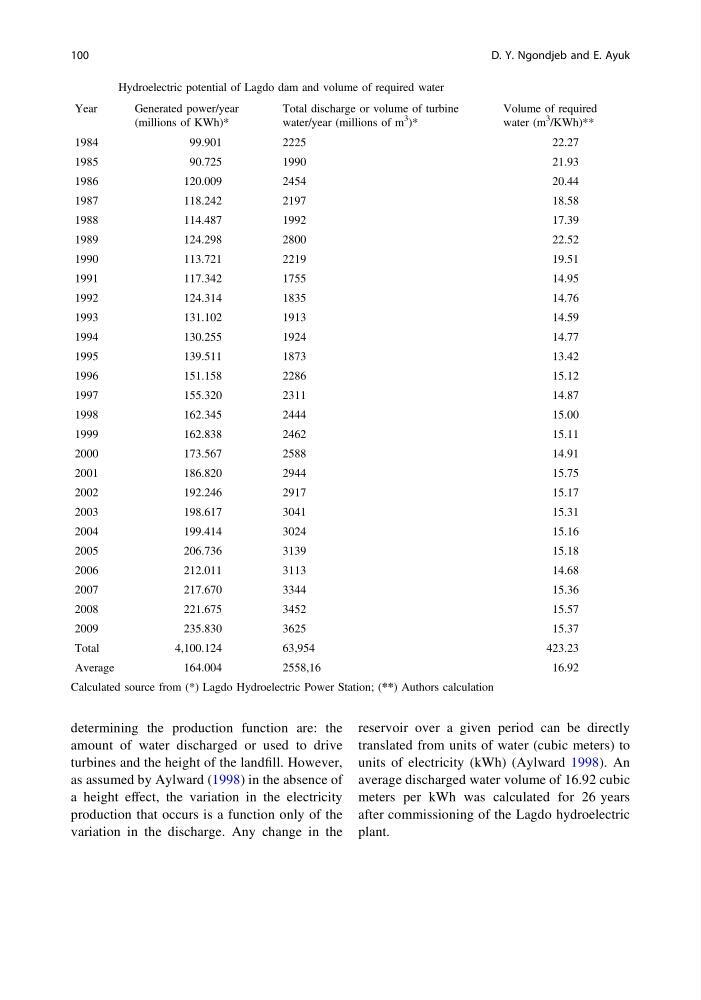
average discharged water volume of 16.92 cubic
meters per kWh was calculated for 26 years
after commissioning of the Lagdo hydroelectric
plant.
Table 2 Hydroelectric potential of Lagdo dam and volume of required water
Year
Generated power/year
(millions of KWh)*
Total discharge or volume of turbine
water/year (millions of m
3
)*
Volume of required
water (m
3
/KWh)**
1984
99.901
2225
22.27
1985
90.725
1990
21.93
1986
120.009
2454
20.44
1987
118.242
2197
18.58
1988
114.487
1992
17.39
1989
124.298
2800
22.52
1990
113.721
2219
19.51
1991
117.342
1755
14.95
1992
124.314
1835
14.76
1993
131.102
1913
14.59
1994
130.255
1924
14.77
1995
139.511
1873
13.42
1996
151.158
2286
15.12
1997
155.320
2311
14.87
1998
162.345
2444
15.00
1999
162.838
2462
15.11
2000
173.567
2588
14.91
2001
186.820
2944
15.75
2002
192.246
2917
15.17
2003
198.617
3041
15.31
2004
199.414
3024
15.16
2005
206.736
3139
15.18
2006
212.011
3113
14.68
2007
217.670
3344
15.36
2008
221.675
3452
15.57
2009
235.830
3625
15.37
Total
4,100.124
63,954
423.23
Average
164.004
2558,16
16.92
Calculated source from (*) Lagdo Hydroelectric Power Station; (**) Authors calculation
100
D. Y. Ngondjeb and E. Ayuk
amount of water discharged or used to drive
turbines and the height of the landfill. However,
as assumed by Aylward (1998) in the absence of
a height effect, the variation in the electricity
production that occurs is a function only of the
variation in the discharge. Any change in the
reservoir over a given period can be directly
translated from units of water (cubic meters) to
units of electricity (kWh) (Aylward 1998). An
average discharged water volume of 16.92 cubic
meters per kWh was calculated for 26 years
after commissioning of the Lagdo hydroelectric
plant.
Table 2 Hydroelectric potential of Lagdo dam and volume of required water
Year
Generated power/year
(millions of KWh)*
Total discharge or volume of turbine
water/year (millions of m
3
)*
Volume of required
water (m
3
/KWh)**
1984
99.901
2225
22.27
1985
90.725
1990
21.93
1986
120.009
2454
20.44
1987
118.242
2197
18.58
1988
114.487
1992
17.39
1989
124.298
2800
22.52
1990
113.721
2219
19.51
1991
117.342
1755
14.95
1992
124.314
1835
14.76
1993
131.102
1913
14.59
1994
130.255
1924
14.77
1995
139.511
1873
13.42
1996
151.158
2286
15.12
1997
155.320
2311
14.87
1998
162.345
2444
15.00
1999
162.838
2462
15.11
2000
173.567
2588
14.91
2001
186.820
2944
15.75
2002
192.246
2917
15.17
2003
198.617
3041
15.31
2004
199.414
3024
15.16
2005
206.736
3139
15.18
2006
212.011
3113
14.68
2007
217.670
3344
15.36
2008
221.675
3452
15.57
2009
235.830
3625
15.37
Total
4,100.124
63,954
423.23
Average
164.004
2558,16
16.92
Calculated source from (*) Lagdo Hydroelectric Power Station; (**) Authors calculation
100
D. Y. Ngondjeb and E. Ayuk