

82
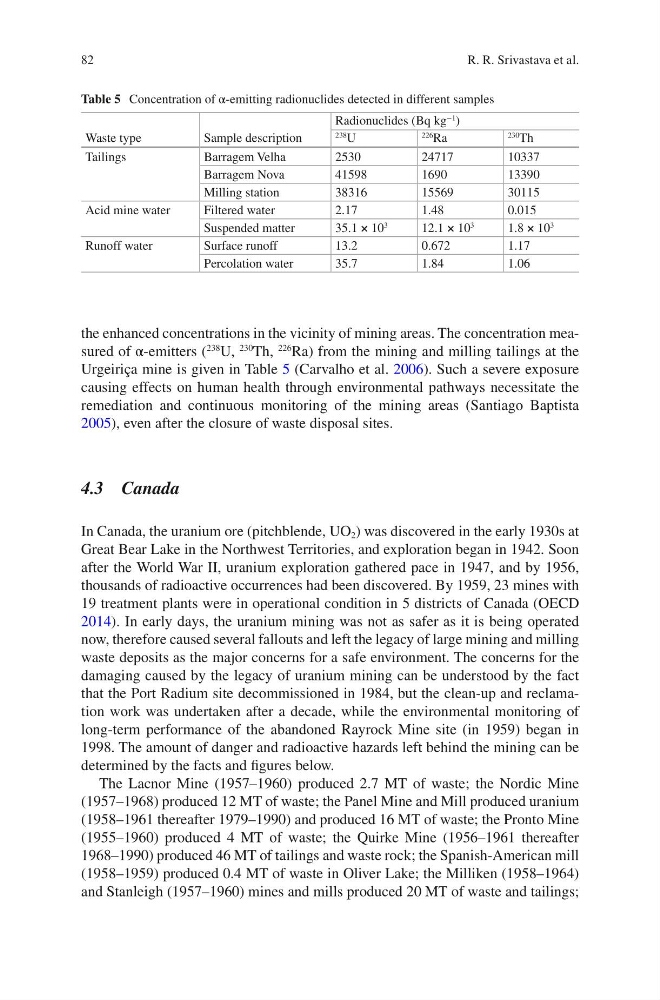
the enhanced concentrations in the vicinity of mining areas. The concentration measured of α-emitters (
238
U,
230
Th,
226
Ra) from the mining and milling tailings at the
Urgeiriça mine is given in Table 5 (Carvalho et al. 2006). Such a severe exposure
causing effects on human health through environmental pathways necessitate the
remediation and continuous monitoring of the mining areas (Santiago Baptista
2005), even after the closure of waste disposal sites.
4.3 Canada
In Canada, the uranium ore (pitchblende, UO 2 ) was discovered in the early 1930s at
Great Bear Lake in the Northwest Territories, and exploration began in 1942. Soon
after the World War II, uranium exploration gathered pace in 1947, and by 1956,
thousands of radioactive occurrences had been discovered. By 1959, 23 mines with
19 treatment plants were in operational condition in 5 districts of Canada (OECD
2014). In early days, the uranium mining was not as safer as it is being operated
now, therefore caused several fallouts and left the legacy of large mining and milling
waste deposits as the major concerns for a safe environment. The concerns for the
damaging caused by the legacy of uranium mining can be understood by the fact
that the Port Radium site decommissioned in 1984, but the clean-up and reclamation work was undertaken after a decade, while the environmental monitoring of
long-term performance of the abandoned Rayrock Mine site (in 1959) began in
1998. The amount of danger and radioactive hazards left behind the mining can be
determined by the facts and figures below.
The Lacnor Mine (1957–1960) produced 2.7 MT of waste; the Nordic Mine
(1957–1968) produced 12 MT of waste; the Panel Mine and Mill produced uranium
(1958–1961 thereafter 1979–1990) and produced 16 MT of waste; the Pronto Mine
(1955–1960) produced 4 MT of waste; the Quirke Mine (1956–1961 thereafter
1968–1990) produced 46 MT of tailings and waste rock; the Spanish-American mill
(1958–1959) produced 0.4 MT of waste in Oliver Lake; the Milliken (1958–1964)
and Stanleigh (1957–1960) mines and mills produced 20 MT of waste and tailings;
Table 5 Concentration of α-emitting radionuclides detected in different samples
Waste type
Sample description
Radionuclides (Bq kg
−1
)
238
U
226 Ra
230 Th
Tailings
Barragem Velha
2530
24717
10337
Barragem Nova
41598
1690
13390
Milling station
38316
15569
30115
Acid mine water
Filtered water
2.17
1.48
0.015
Suspended matter
35.1 × 10
3
12.1 × 10
3
1.8 × 10
3
Runoff water
Surface runoff
13.2
0.672
1.17
Percolation water
35.7
1.84
1.06
R. R. Srivastava et al.
the enhanced concentrations in the vicinity of mining areas. The concentration measured of α-emitters (
238
U,
230
Th,
226
Ra) from the mining and milling tailings at the
Urgeiriça mine is given in Table 5 (Carvalho et al. 2006). Such a severe exposure
causing effects on human health through environmental pathways necessitate the
remediation and continuous monitoring of the mining areas (Santiago Baptista
2005), even after the closure of waste disposal sites.
4.3 Canada
In Canada, the uranium ore (pitchblende, UO 2 ) was discovered in the early 1930s at
Great Bear Lake in the Northwest Territories, and exploration began in 1942. Soon
after the World War II, uranium exploration gathered pace in 1947, and by 1956,
thousands of radioactive occurrences had been discovered. By 1959, 23 mines with
19 treatment plants were in operational condition in 5 districts of Canada (OECD
2014). In early days, the uranium mining was not as safer as it is being operated
now, therefore caused several fallouts and left the legacy of large mining and milling
waste deposits as the major concerns for a safe environment. The concerns for the
damaging caused by the legacy of uranium mining can be understood by the fact
that the Port Radium site decommissioned in 1984, but the clean-up and reclamation work was undertaken after a decade, while the environmental monitoring of
long-term performance of the abandoned Rayrock Mine site (in 1959) began in
1998. The amount of danger and radioactive hazards left behind the mining can be
determined by the facts and figures below.
The Lacnor Mine (1957–1960) produced 2.7 MT of waste; the Nordic Mine
(1957–1968) produced 12 MT of waste; the Panel Mine and Mill produced uranium
(1958–1961 thereafter 1979–1990) and produced 16 MT of waste; the Pronto Mine
(1955–1960) produced 4 MT of waste; the Quirke Mine (1956–1961 thereafter
1968–1990) produced 46 MT of tailings and waste rock; the Spanish-American mill
(1958–1959) produced 0.4 MT of waste in Oliver Lake; the Milliken (1958–1964)
and Stanleigh (1957–1960) mines and mills produced 20 MT of waste and tailings;
Table 5 Concentration of α-emitting radionuclides detected in different samples
Waste type
Sample description
Radionuclides (Bq kg
−1
)
238
U
226 Ra
230 Th
Tailings
Barragem Velha
2530
24717
10337
Barragem Nova
41598
1690
13390
Milling station
38316
15569
30115
Acid mine water
Filtered water
2.17
1.48
0.015
Suspended matter
35.1 × 10
3
12.1 × 10
3
1.8 × 10
3
Runoff water
Surface runoff
13.2
0.672
1.17
Percolation water
35.7
1.84
1.06
R. R. Srivastava et al.