

238
ranges from 6.3 to 72.4 μSv with an average of 23.07 μSv which is safely below the
recommended limit of 100 μSv (WHO 2004). The distribution of effective dose to
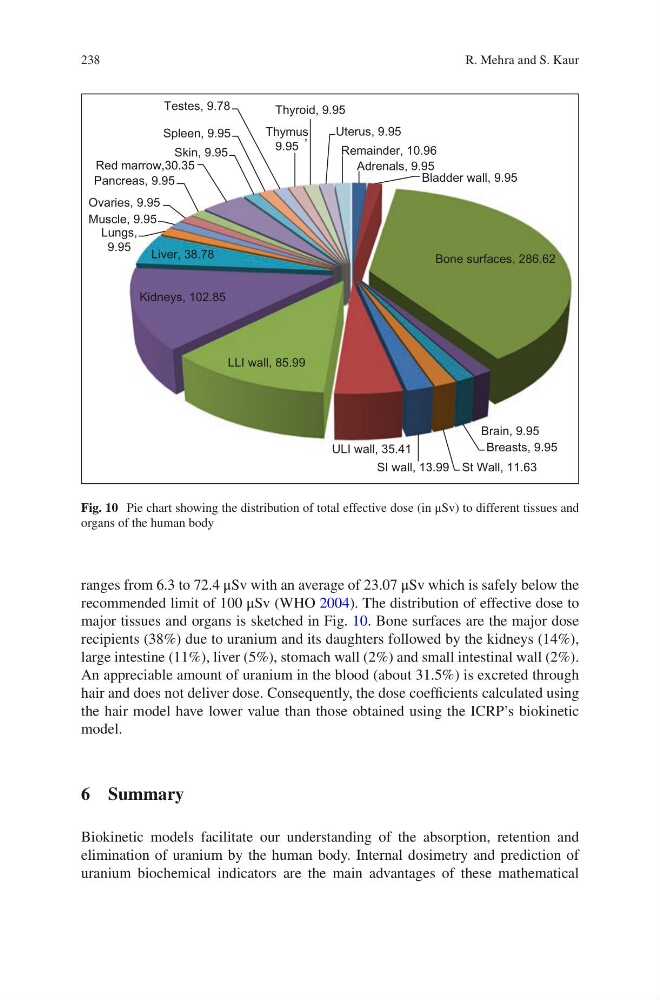
major tissues and organs is sketched in Fig. 10. Bone surfaces are the major dose
recipients (38%) due to uranium and its daughters followed by the kidneys (14%),
large intestine (11%), liver (5%), stomach wall (2%) and small intestinal wall (2%).
An appreciable amount of uranium in the blood (about 31.5%) is excreted through
hair and does not deliver dose. Consequently, the dose coefficients calculated using
the hair model have lower value than those obtained using the ICRP’s biokinetic
model.
6 Summary
Biokinetic models facilitate our understanding of the absorption, retention and
elimination of uranium by the human body. Internal dosimetry and prediction of
uranium biochemical indicators are the main advantages of these mathematical
Adrenals, 9.95
Bladder wall, 9.95
Bone surfaces, 286.62
Brain, 9.95
Breasts, 9.95
St Wall, 11.63
SI wall, 13.99
ULI wall, 35.41
LLI wall, 85.99
Kidneys, 102.85
Liver, 38.78
Lungs,
9.95
Muscle, 9.95
Ovaries, 9.95
Pancreas, 9.95
Red marrow,30.35
Skin, 9.95
Spleen, 9.95
Testes, 9.78
Thymus
9.95
,
Thyroid, 9.95
Uterus, 9.95
Remainder, 10.96
Fig. 10 Pie chart showing the distribution of total effective dose (in μSv) to different tissues and
organs of the human body
R. Mehra and S. Kaur
ranges from 6.3 to 72.4 μSv with an average of 23.07 μSv which is safely below the
recommended limit of 100 μSv (WHO 2004). The distribution of effective dose to
major tissues and organs is sketched in Fig. 10. Bone surfaces are the major dose
recipients (38%) due to uranium and its daughters followed by the kidneys (14%),
large intestine (11%), liver (5%), stomach wall (2%) and small intestinal wall (2%).
An appreciable amount of uranium in the blood (about 31.5%) is excreted through
hair and does not deliver dose. Consequently, the dose coefficients calculated using
the hair model have lower value than those obtained using the ICRP’s biokinetic
model.
6 Summary
Biokinetic models facilitate our understanding of the absorption, retention and
elimination of uranium by the human body. Internal dosimetry and prediction of
uranium biochemical indicators are the main advantages of these mathematical
Adrenals, 9.95
Bladder wall, 9.95
Bone surfaces, 286.62
Brain, 9.95
Breasts, 9.95
St Wall, 11.63
SI wall, 13.99
ULI wall, 35.41
LLI wall, 85.99
Kidneys, 102.85
Liver, 38.78
Lungs,
9.95
Muscle, 9.95
Ovaries, 9.95
Pancreas, 9.95
Red marrow,30.35
Skin, 9.95
Spleen, 9.95
Testes, 9.78
Thymus
9.95
,
Thyroid, 9.95
Uterus, 9.95
Remainder, 10.96
Fig. 10 Pie chart showing the distribution of total effective dose (in μSv) to different tissues and
organs of the human body
R. Mehra and S. Kaur