

177
4 Soil-to-Crop Transfer Factor of U from a Field Study
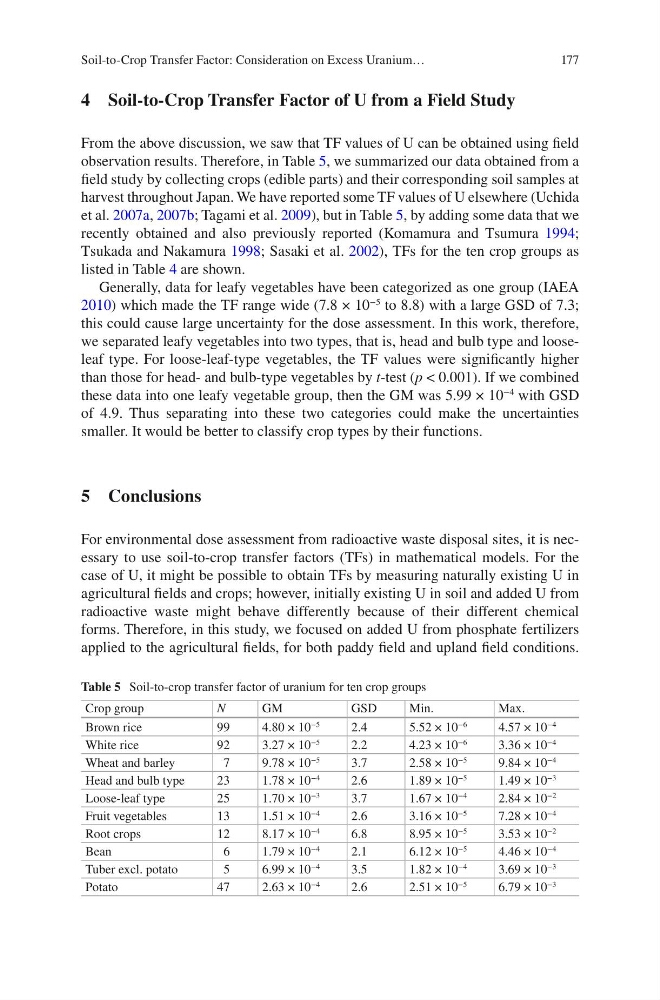
From the above discussion, we saw that TF values of U can be obtained using field
observation results. Therefore, in Table 5, we summarized our data obtained from a
field study by collecting crops (edible parts) and their corresponding soil samples at
harvest throughout Japan. We have reported some TF values of U elsewhere (Uchida
et al. 2007a, 2007b; Tagami et al. 2009), but in Table 5, by adding some data that we
recently obtained and also previously reported (Komamura and Tsumura 1994;
Tsukada and Nakamura 1998; Sasaki et al. 2002), TFs for the ten crop groups as
listed in Table 4 are shown.
Generally, data for leafy vegetables have been categorized as one group (IAEA
2010) which made the TF range wide (7.8 × 10
−5
to 8.8) with a large GSD of 7.3;
this could cause large uncertainty for the dose assessment. In this work, therefore,
we separated leafy vegetables into two types, that is, head and bulb type and looseleaf type. For loose-leaf-type vegetables, the TF values were significantly higher
than those for head- and bulb-type vegetables by t-test (p < 0.001). If we combined
these data into one leafy vegetable group, then the GM was 5.99 × 10
−4
with GSD
of 4.9. Thus separating into these two categories could make the uncertainties
smaller. It would be better to classify crop types by their functions.
5 Conclusions
For environmental dose assessment from radioactive waste disposal sites, it is necessary to use soil-to-crop transfer factors (TFs) in mathematical models. For the
case of U, it might be possible to obtain TFs by measuring naturally existing U in
agricultural fields and crops; however, initially existing U in soil and added U from
radioactive waste might behave differently because of their different chemical
forms. Therefore, in this study, we focused on added U from phosphate fertilizers
applied to the agricultural fields, for both paddy field and upland field conditions.
Table 5 Soil-to-crop transfer factor of uranium for ten crop groups
Crop group
N
GM
GSD
Min.
Max.
Brown rice
99
4.80 × 10
−5
2.4
5.52 × 10
−6
4.57 × 10
−4
White rice
92
3.27 × 10
−5
2.2
4.23 × 10
−6
3.36 × 10
−4
Wheat and barley
7
9.78 × 10
−5
3.7
2.58 × 10
−5
9.84 × 10
−4
Head and bulb type
23
1.78 × 10
−4
2.6
1.89 × 10
−5
1.49 × 10
−3
Loose-leaf type
25
1.70 × 10
−3
3.7
1.67 × 10
−4
2.84 × 10
−2
Fruit vegetables
13
1.51 × 10
−4
2.6
3.16 × 10
−5
7.28 × 10
−4
Root crops
12
8.17 × 10
−4
6.8
8.95 × 10
−5
3.53 × 10
−2
Bean
6
1.79 × 10
−4
2.1
6.12 × 10
−5
4.46 × 10
−4
Tuber excl. potato
5
6.99 × 10
−4
3.5
1.82 × 10
−4
3.69 × 10
−3
Potato
47
2.63 × 10
−4
2.6
2.51 × 10
−5
6.79 × 10
−3
Soil-to-Crop Transfer Factor: Consideration on Excess Uranium…
4 Soil-to-Crop Transfer Factor of U from a Field Study
From the above discussion, we saw that TF values of U can be obtained using field
observation results. Therefore, in Table 5, we summarized our data obtained from a
field study by collecting crops (edible parts) and their corresponding soil samples at
harvest throughout Japan. We have reported some TF values of U elsewhere (Uchida
et al. 2007a, 2007b; Tagami et al. 2009), but in Table 5, by adding some data that we
recently obtained and also previously reported (Komamura and Tsumura 1994;
Tsukada and Nakamura 1998; Sasaki et al. 2002), TFs for the ten crop groups as
listed in Table 4 are shown.
Generally, data for leafy vegetables have been categorized as one group (IAEA
2010) which made the TF range wide (7.8 × 10
−5
to 8.8) with a large GSD of 7.3;
this could cause large uncertainty for the dose assessment. In this work, therefore,
we separated leafy vegetables into two types, that is, head and bulb type and looseleaf type. For loose-leaf-type vegetables, the TF values were significantly higher
than those for head- and bulb-type vegetables by t-test (p < 0.001). If we combined
these data into one leafy vegetable group, then the GM was 5.99 × 10
−4
with GSD
of 4.9. Thus separating into these two categories could make the uncertainties
smaller. It would be better to classify crop types by their functions.
5 Conclusions
For environmental dose assessment from radioactive waste disposal sites, it is necessary to use soil-to-crop transfer factors (TFs) in mathematical models. For the
case of U, it might be possible to obtain TFs by measuring naturally existing U in
agricultural fields and crops; however, initially existing U in soil and added U from
radioactive waste might behave differently because of their different chemical
forms. Therefore, in this study, we focused on added U from phosphate fertilizers
applied to the agricultural fields, for both paddy field and upland field conditions.
Table 5 Soil-to-crop transfer factor of uranium for ten crop groups
Crop group
N
GM
GSD
Min.
Max.
Brown rice
99
4.80 × 10
−5
2.4
5.52 × 10
−6
4.57 × 10
−4
White rice
92
3.27 × 10
−5
2.2
4.23 × 10
−6
3.36 × 10
−4
Wheat and barley
7
9.78 × 10
−5
3.7
2.58 × 10
−5
9.84 × 10
−4
Head and bulb type
23
1.78 × 10
−4
2.6
1.89 × 10
−5
1.49 × 10
−3
Loose-leaf type
25
1.70 × 10
−3
3.7
1.67 × 10
−4
2.84 × 10
−2
Fruit vegetables
13
1.51 × 10
−4
2.6
3.16 × 10
−5
7.28 × 10
−4
Root crops
12
8.17 × 10
−4
6.8
8.95 × 10
−5
3.53 × 10
−2
Bean
6
1.79 × 10
−4
2.1
6.12 × 10
−5
4.46 × 10
−4
Tuber excl. potato
5
6.99 × 10
−4
3.5
1.82 × 10
−4
3.69 × 10
−3
Potato
47
2.63 × 10
−4
2.6
2.51 × 10
−5
6.79 × 10
−3
Soil-to-Crop Transfer Factor: Consideration on Excess Uranium…