

When intermediary profits are found to be out of proportion
with the production block which also employs individuals
attempting to rise out of poverty many questions are left
unanswered.
In many cases the indirect channel is a vestige of the past.
As large retailers continue to squeeze out wholesalers, the
question becomes which end of the value chain will win the
battle? If retailers control their suppliers, then they will force
lower profits for producers and maintain higher profits online
or at the store. On the other hand, if producers can create
value by retaining earnings and balance the share of capital
employed fewer manufacturing jobs will be lost. Moreover,
this model will aid governments in shifting the focus and
Table 4 Income statements top
3 US-listed retailers
WMT
Cost
KR
Aggregate
Revenue
1/31/2018
09-02-18
02-03-18
Total revenue
500,343,000
141,576,000
122,662,000
764,581,000
Cost of revenue
373,396,000
123,152,000
95,662,000
592,210,000
Gross profit
126,947,000
18,424,000
27,000,000
172,371,000
Research development
0
0
0
0
Selling general and administrative
104,698,000
13,876,000
22,114,000
140,688,000
Nonrecurring
0
0
0
0
Others
0
0
0
0
Total operating expenses
478,094,000
137,096,000
120,212,000
735,402,000
Operating income or loss
22,249,000
4,480,000
2,450,000
29,179,000
Total other income/expenses net
−7,126,000
−38,000
−966,000
−8,130,000
Earnings before interest and taxes
22,249,000
4,480,000
2,450,000
29,179,000
Interest expense
−2,330,000
−159,000
−601,000
−3,090,000
Income before tax
15,123,000
4,442,000
1,484,000
21,049,000
Income tax expense
4,600,000
1,263,000
−405,000
5,458,000
Minority interest
2,953,000
304,000
−26,000
3,231,000
Net income
9,862,000
3,134,000
1,907,000
14,903,000
Dividends paid
6,124,000
804,000
443,000
7,371,000
Depreciation
10,529,000
1,370,000
2,495,000
14,394,000
N. employees
2,300,000
245,000
449,000
2,994,000
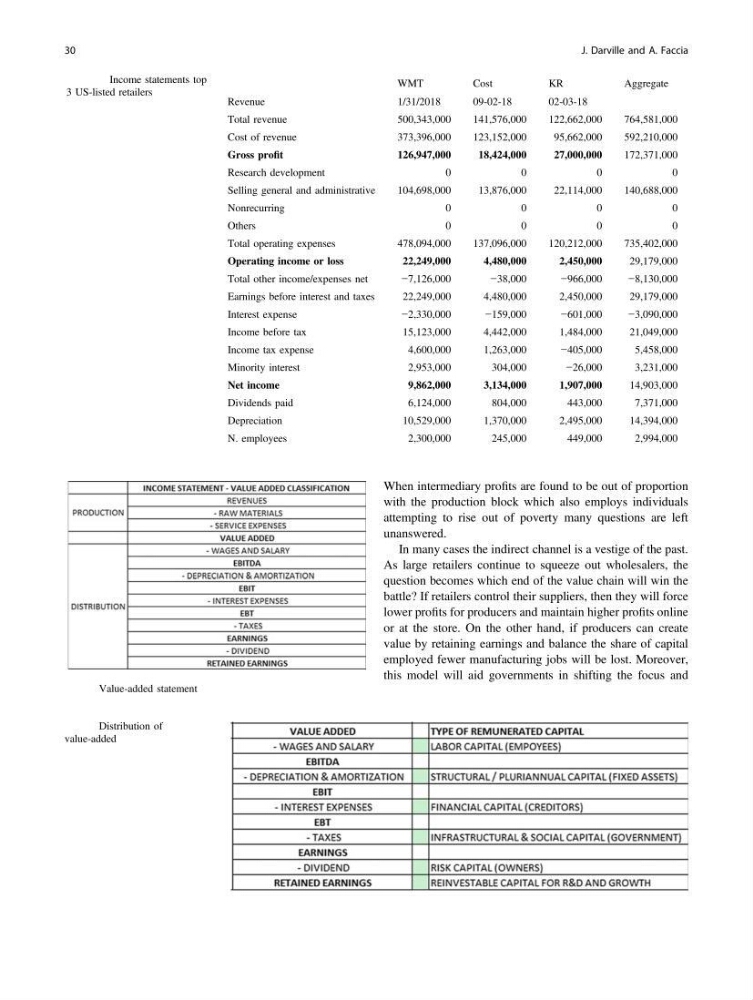
Fig. 1 Value-added statement
Fig. 2 Distribution of
value-added
30
J. Darville and A. Faccia
with the production block which also employs individuals
attempting to rise out of poverty many questions are left
unanswered.
In many cases the indirect channel is a vestige of the past.
As large retailers continue to squeeze out wholesalers, the
question becomes which end of the value chain will win the
battle? If retailers control their suppliers, then they will force
lower profits for producers and maintain higher profits online
or at the store. On the other hand, if producers can create
value by retaining earnings and balance the share of capital
employed fewer manufacturing jobs will be lost. Moreover,
this model will aid governments in shifting the focus and
Table 4 Income statements top
3 US-listed retailers
WMT
Cost
KR
Aggregate
Revenue
1/31/2018
09-02-18
02-03-18
Total revenue
500,343,000
141,576,000
122,662,000
764,581,000
Cost of revenue
373,396,000
123,152,000
95,662,000
592,210,000
Gross profit
126,947,000
18,424,000
27,000,000
172,371,000
Research development
0
0
0
0
Selling general and administrative
104,698,000
13,876,000
22,114,000
140,688,000
Nonrecurring
0
0
0
0
Others
0
0
0
0
Total operating expenses
478,094,000
137,096,000
120,212,000
735,402,000
Operating income or loss
22,249,000
4,480,000
2,450,000
29,179,000
Total other income/expenses net
−7,126,000
−38,000
−966,000
−8,130,000
Earnings before interest and taxes
22,249,000
4,480,000
2,450,000
29,179,000
Interest expense
−2,330,000
−159,000
−601,000
−3,090,000
Income before tax
15,123,000
4,442,000
1,484,000
21,049,000
Income tax expense
4,600,000
1,263,000
−405,000
5,458,000
Minority interest
2,953,000
304,000
−26,000
3,231,000
Net income
9,862,000
3,134,000
1,907,000
14,903,000
Dividends paid
6,124,000
804,000
443,000
7,371,000
Depreciation
10,529,000
1,370,000
2,495,000
14,394,000
N. employees
2,300,000
245,000
449,000
2,994,000
Fig. 1 Value-added statement
Fig. 2 Distribution of
value-added
30
J. Darville and A. Faccia