

with expectations. It should be noted that due to lack of time
it was not possible to reclassify the added value in detail, in
the tables shown there is therefore no distinction between the
cost of goods sold and labor expenses, both included in the
purchase expenses. The remuneration of labor in this analysis will therefore not be considered. Further details of those
values will be the object of subsequent studies.
The producers mainly remunerate the infrastructural
(social) capital. This is assumed to be because production
companies cannot easily relocate production in the presence
of high tax rates (see Fig. 4).
Infrastructural and structural capital return represent the
stakeholders that absorb the main part of added value at the
time of its distribution (see Fig. 5) for the wholesalers.
Structural and risk capital return represent the stakeholders that absorb the main part of added value at the time
of its distribution (see Fig. 6) for the retailers.
Considering the level of employment (see Fig. 7), it
can be seen that producers are the component of the value
chain that contribute most to increasing jobs as a percentage of revenue. Wholesalers, but especially retailers,
provide the lowest contribution to the level of employment in terms of percentage of revenues. We could
therefore affirm that these two links in the supply chain,
which represent only intermediaries between production and the consumer, are not very useful socially,
from the point of view of the target of reducing
unemployment.
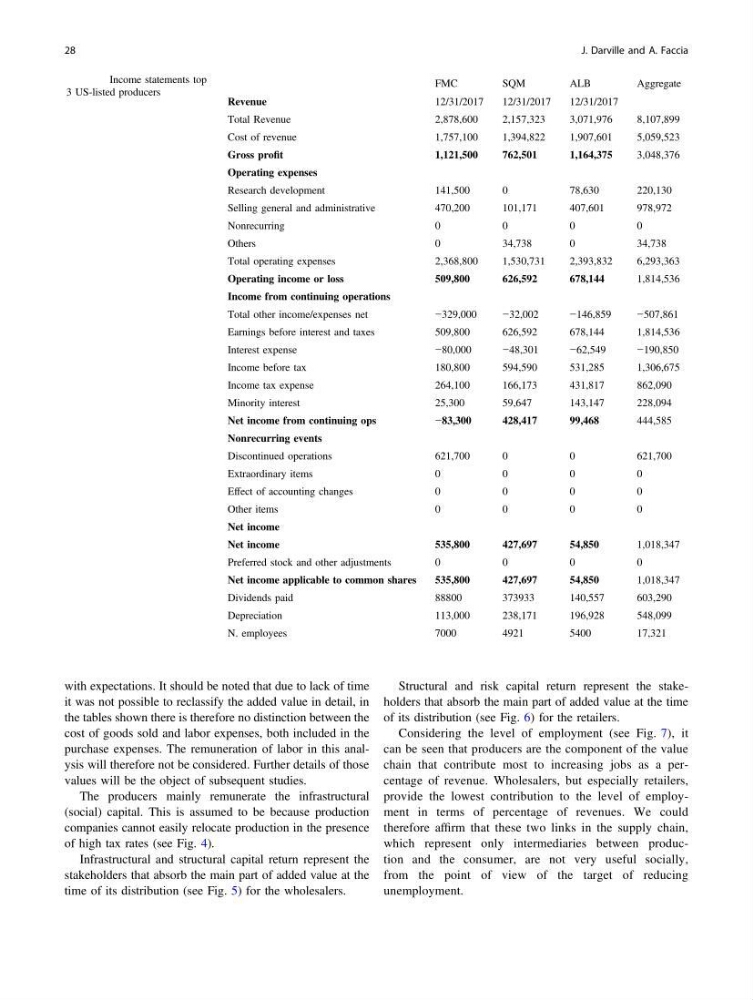
Table 2 Income statements top
3 US-listed producers
FMC
SQM
ALB
Aggregate
Revenue
12/31/2017
12/31/2017
12/31/2017
Total Revenue
2,878,600
2,157,323
3,071,976
8,107,899
Cost of revenue
1,757,100
1,394,822
1,907,601
5,059,523
Gross profit
1,121,500
762,501
1,164,375
3,048,376
Operating expenses
Research development
141,500
0
78,630
220,130
Selling general and administrative
470,200
101,171
407,601
978,972
Nonrecurring
0
0
0
0
Others
0
34,738
0
34,738
Total operating expenses
2,368,800
1,530,731
2,393,832
6,293,363
Operating income or loss
509,800
626,592
678,144
1,814,536
Income from continuing operations
Total other income/expenses net
−329,000
−32,002
−146,859
−507,861
Earnings before interest and taxes
509,800
626,592
678,144
1,814,536
Interest expense
−80,000
−48,301
−62,549
−190,850
Income before tax
180,800
594,590
531,285
1,306,675
Income tax expense
264,100
166,173
431,817
862,090
Minority interest
25,300
59,647
143,147
228,094
Net income from continuing ops
−83,300
428,417
99,468
444,585
Nonrecurring events
Discontinued operations
621,700
0
0
621,700
Extraordinary items
0
0
0
0
Effect of accounting changes
0
0
0
0
Other items
0
0
0
0
Net income
Net income
535,800
427,697
54,850
1,018,347
Preferred stock and other adjustments
0
0
0
0
Net income applicable to common shares
535,800
427,697
54,850
1,018,347
Dividends paid
88800
373933
140,557
603,290
Depreciation
113,000
238,171
196,928
548,099
N. employees
7000
4921
5400
17,321
28
J. Darville and A. Faccia
it was not possible to reclassify the added value in detail, in
the tables shown there is therefore no distinction between the
cost of goods sold and labor expenses, both included in the
purchase expenses. The remuneration of labor in this analysis will therefore not be considered. Further details of those
values will be the object of subsequent studies.
The producers mainly remunerate the infrastructural
(social) capital. This is assumed to be because production
companies cannot easily relocate production in the presence
of high tax rates (see Fig. 4).
Infrastructural and structural capital return represent the
stakeholders that absorb the main part of added value at the
time of its distribution (see Fig. 5) for the wholesalers.
Structural and risk capital return represent the stakeholders that absorb the main part of added value at the time
of its distribution (see Fig. 6) for the retailers.
Considering the level of employment (see Fig. 7), it
can be seen that producers are the component of the value
chain that contribute most to increasing jobs as a percentage of revenue. Wholesalers, but especially retailers,
provide the lowest contribution to the level of employment in terms of percentage of revenues. We could
therefore affirm that these two links in the supply chain,
which represent only intermediaries between production and the consumer, are not very useful socially,
from the point of view of the target of reducing
unemployment.
Table 2 Income statements top
3 US-listed producers
FMC
SQM
ALB
Aggregate
Revenue
12/31/2017
12/31/2017
12/31/2017
Total Revenue
2,878,600
2,157,323
3,071,976
8,107,899
Cost of revenue
1,757,100
1,394,822
1,907,601
5,059,523
Gross profit
1,121,500
762,501
1,164,375
3,048,376
Operating expenses
Research development
141,500
0
78,630
220,130
Selling general and administrative
470,200
101,171
407,601
978,972
Nonrecurring
0
0
0
0
Others
0
34,738
0
34,738
Total operating expenses
2,368,800
1,530,731
2,393,832
6,293,363
Operating income or loss
509,800
626,592
678,144
1,814,536
Income from continuing operations
Total other income/expenses net
−329,000
−32,002
−146,859
−507,861
Earnings before interest and taxes
509,800
626,592
678,144
1,814,536
Interest expense
−80,000
−48,301
−62,549
−190,850
Income before tax
180,800
594,590
531,285
1,306,675
Income tax expense
264,100
166,173
431,817
862,090
Minority interest
25,300
59,647
143,147
228,094
Net income from continuing ops
−83,300
428,417
99,468
444,585
Nonrecurring events
Discontinued operations
621,700
0
0
621,700
Extraordinary items
0
0
0
0
Effect of accounting changes
0
0
0
0
Other items
0
0
0
0
Net income
Net income
535,800
427,697
54,850
1,018,347
Preferred stock and other adjustments
0
0
0
0
Net income applicable to common shares
535,800
427,697
54,850
1,018,347
Dividends paid
88800
373933
140,557
603,290
Depreciation
113,000
238,171
196,928
548,099
N. employees
7000
4921
5400
17,321
28
J. Darville and A. Faccia