

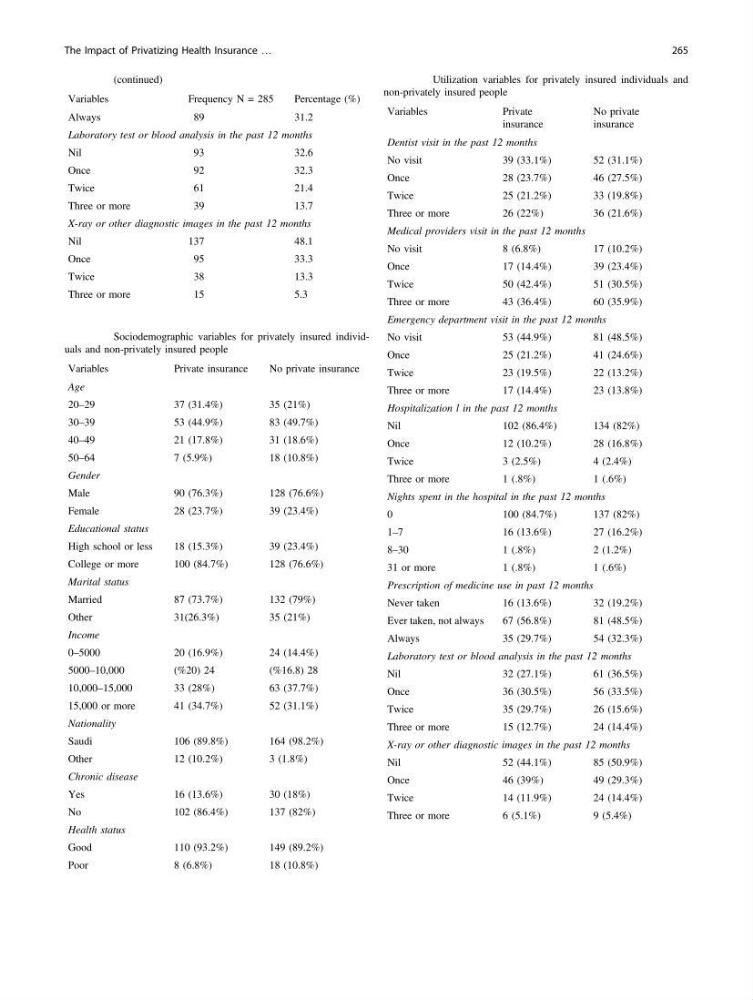
Table 21 Sociodemographic variables for privately insured individuals and non-privately insured people
Variables
Private insurance
No private insurance
Age
20–29
37 (31.4%)
35 (21%)
30–39
53 (44.9%)
83 (49.7%)
40–49
21 (17.8%)
31 (18.6%)
50–64
7 (5.9%)
18 (10.8%)
Gender
Male
90 (76.3%)
128 (76.6%)
Female
28 (23.7%)
39 (23.4%)
Educational status
High school or less
18 (15.3%)
39 (23.4%)
College or more
100 (84.7%)
128 (76.6%)
Marital status
Married
87 (73.7%)
132 (79%)
Other
31(26.3%)
35 (21%)
Income
0–5000
20 (16.9%)
24 (14.4%)
5000–10,000
(%20) 24
(%16.8) 28
10,000–15,000
33 (28%)
63 (37.7%)
15,000 or more
41 (34.7%)
52 (31.1%)
Nationality
Saudi
106 (89.8%)
164 (98.2%)
Other
12 (10.2%)
3 (1.8%)
Chronic disease
Yes
16 (13.6%)
30 (18%)
No
102 (86.4%)
137 (82%)
Health status
Good
110 (93.2%)
149 (89.2%)
Poor
8 (6.8%)
18 (10.8%)
Table 22 Utilization variables for privately insured individuals and
non-privately insured people
Variables
Private
insurance
No private
insurance
Dentist visit in the past 12 months
No visit
39 (33.1%)
52 (31.1%)
Once
28 (23.7%)
46 (27.5%)
Twice
25 (21.2%)
33 (19.8%)
Three or more
26 (22%)
36 (21.6%)
Medical providers visit in the past 12 months
No visit
8 (6.8%)
17 (10.2%)
Once
17 (14.4%)
39 (23.4%)
Twice
50 (42.4%)
51 (30.5%)
Three or more
43 (36.4%)
60 (35.9%)
Emergency department visit in the past 12 months
No visit
53 (44.9%)
81 (48.5%)
Once
25 (21.2%)
41 (24.6%)
Twice
23 (19.5%)
22 (13.2%)
Three or more
17 (14.4%)
23 (13.8%)
Hospitalization l in the past 12 months
Nil
102 (86.4%)
134 (82%)
Once
12 (10.2%)
28 (16.8%)
Twice
3 (2.5%)
4 (2.4%)
Three or more
1 (.8%)
1 (.6%)
Nights spent in the hospital in the past 12 months
0
100 (84.7%)
137 (82%)
1–7
16 (13.6%)
27 (16.2%)
8–30
1 (.8%)
2 (1.2%)
31 or more
1 (.8%)
1 (.6%)
Prescription of medicine use in past 12 months
Never taken
16 (13.6%)
32 (19.2%)
Ever taken, not always
67 (56.8%)
81 (48.5%)
Always
35 (29.7%)
54 (32.3%)
Laboratory test or blood analysis in the past 12 months
Nil
32 (27.1%)
61 (36.5%)
Once
36 (30.5%)
56 (33.5%)
Twice
35 (29.7%)
26 (15.6%)
Three or more
15 (12.7%)
24 (14.4%)
X-ray or other diagnostic images in the past 12 months
Nil
52 (44.1%)
85 (50.9%)
Once
46 (39%)
49 (29.3%)
Twice
14 (11.9%)
24 (14.4%)
Three or more
6 (5.1%)
9 (5.4%)
Table 20 (continued)
Variables
Frequency N = 285
Percentage (%)
Always
89
31.2
Laboratory test or blood analysis in the past 12 months
Nil
93
32.6
Once
92
32.3
Twice
61
21.4
Three or more
39
13.7
X-ray or other diagnostic images in the past 12 months
Nil
137
48.1
Once
95
33.3
Twice
38
13.3
Three or more
15
5.3
The Impact of Privatizing Health Insurance …
265
Variables
Private insurance
No private insurance
Age
20–29
37 (31.4%)
35 (21%)
30–39
53 (44.9%)
83 (49.7%)
40–49
21 (17.8%)
31 (18.6%)
50–64
7 (5.9%)
18 (10.8%)
Gender
Male
90 (76.3%)
128 (76.6%)
Female
28 (23.7%)
39 (23.4%)
Educational status
High school or less
18 (15.3%)
39 (23.4%)
College or more
100 (84.7%)
128 (76.6%)
Marital status
Married
87 (73.7%)
132 (79%)
Other
31(26.3%)
35 (21%)
Income
0–5000
20 (16.9%)
24 (14.4%)
5000–10,000
(%20) 24
(%16.8) 28
10,000–15,000
33 (28%)
63 (37.7%)
15,000 or more
41 (34.7%)
52 (31.1%)
Nationality
Saudi
106 (89.8%)
164 (98.2%)
Other
12 (10.2%)
3 (1.8%)
Chronic disease
Yes
16 (13.6%)
30 (18%)
No
102 (86.4%)
137 (82%)
Health status
Good
110 (93.2%)
149 (89.2%)
Poor
8 (6.8%)
18 (10.8%)
Table 22 Utilization variables for privately insured individuals and
non-privately insured people
Variables
Private
insurance
No private
insurance
Dentist visit in the past 12 months
No visit
39 (33.1%)
52 (31.1%)
Once
28 (23.7%)
46 (27.5%)
Twice
25 (21.2%)
33 (19.8%)
Three or more
26 (22%)
36 (21.6%)
Medical providers visit in the past 12 months
No visit
8 (6.8%)
17 (10.2%)
Once
17 (14.4%)
39 (23.4%)
Twice
50 (42.4%)
51 (30.5%)
Three or more
43 (36.4%)
60 (35.9%)
Emergency department visit in the past 12 months
No visit
53 (44.9%)
81 (48.5%)
Once
25 (21.2%)
41 (24.6%)
Twice
23 (19.5%)
22 (13.2%)
Three or more
17 (14.4%)
23 (13.8%)
Hospitalization l in the past 12 months
Nil
102 (86.4%)
134 (82%)
Once
12 (10.2%)
28 (16.8%)
Twice
3 (2.5%)
4 (2.4%)
Three or more
1 (.8%)
1 (.6%)
Nights spent in the hospital in the past 12 months
0
100 (84.7%)
137 (82%)
1–7
16 (13.6%)
27 (16.2%)
8–30
1 (.8%)
2 (1.2%)
31 or more
1 (.8%)
1 (.6%)
Prescription of medicine use in past 12 months
Never taken
16 (13.6%)
32 (19.2%)
Ever taken, not always
67 (56.8%)
81 (48.5%)
Always
35 (29.7%)
54 (32.3%)
Laboratory test or blood analysis in the past 12 months
Nil
32 (27.1%)
61 (36.5%)
Once
36 (30.5%)
56 (33.5%)
Twice
35 (29.7%)
26 (15.6%)
Three or more
15 (12.7%)
24 (14.4%)
X-ray or other diagnostic images in the past 12 months
Nil
52 (44.1%)
85 (50.9%)
Once
46 (39%)
49 (29.3%)
Twice
14 (11.9%)
24 (14.4%)
Three or more
6 (5.1%)
9 (5.4%)
Table 20 (continued)
Variables
Frequency N = 285
Percentage (%)
Always
89
31.2
Laboratory test or blood analysis in the past 12 months
Nil
93
32.6
Once
92
32.3
Twice
61
21.4
Three or more
39
13.7
X-ray or other diagnostic images in the past 12 months
Nil
137
48.1
Once
95
33.3
Twice
38
13.3
Three or more
15
5.3
The Impact of Privatizing Health Insurance …
265