

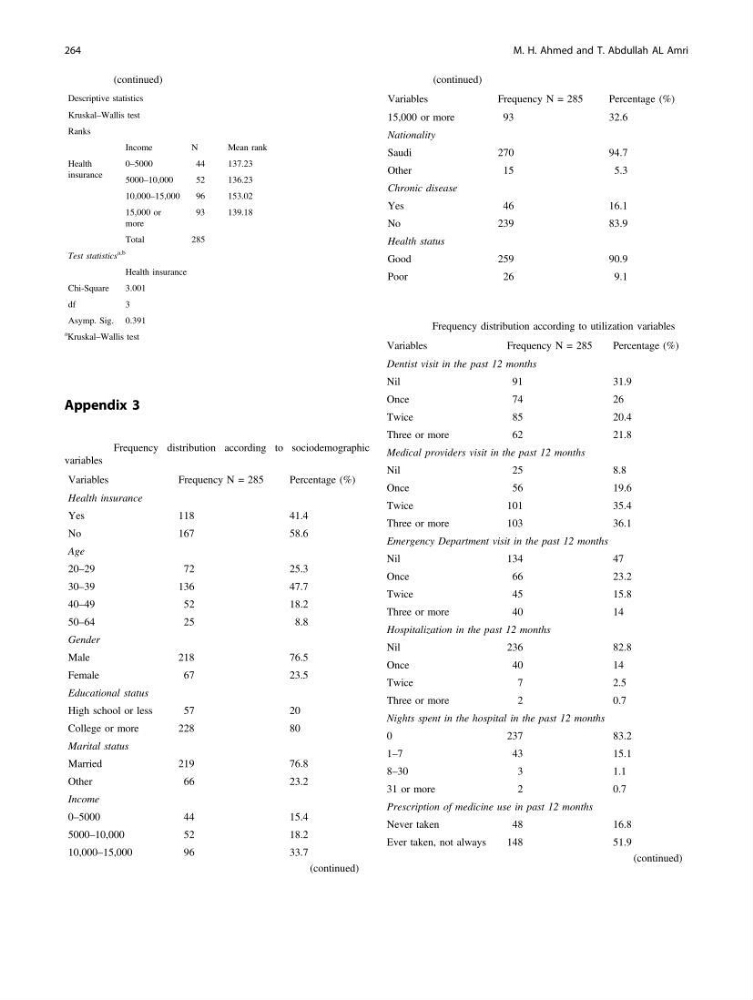
Appendix 3
Table 18 (continued)
Descriptive statistics
Kruskal–Wallis test
Ranks
Income
N
Mean rank
Health
insurance
0–5000
44
137.23
5000–10,000
52
136.23
10,000–15,000
96
153.02
15,000 or
more
93
139.18
Total
285
Test statistics
a,b
Health insurance
Chi-Square
3.001
df
3
Asymp. Sig. 0.391
a
Kruskal–Wallis test
Table 19 Frequency distribution according to sociodemographic
variables
Variables
Frequency N = 285
Percentage (%)
Health insurance
Yes
118
41.4
No
167
58.6
Age
20–29
72
25.3
30–39
136
47.7
40–49
52
18.2
50–64
25
8.8
Gender
Male
218
76.5
Female
67
23.5
Educational status
High school or less
57
20
College or more
228
80
Marital status
Married
219
76.8
Other
66
23.2
Income
0–5000
44
15.4
5000–10,000
52
18.2
10,000–15,000
96
33.7
(continued)
Table 19 (continued)
Variables
Frequency N = 285
Percentage (%)
15,000 or more
93
32.6
Nationality
Saudi
270
94.7
Other
15
5.3
Chronic disease
Yes
46
16.1
No
239
83.9
Health status
Good
259
90.9
Poor
26
9.1
Table 20 Frequency distribution according to utilization variables
Variables
Frequency N = 285
Percentage (%)
Dentist visit in the past 12 months
Nil
91
31.9
Once
74
26
Twice
85
20.4
Three or more
62
21.8
Medical providers visit in the past 12 months
Nil
25
8.8
Once
56
19.6
Twice
101
35.4
Three or more
103
36.1
Emergency Department visit in the past 12 months
Nil
134
47
Once
66
23.2
Twice
45
15.8
Three or more
40
14
Hospitalization in the past 12 months
Nil
236
82.8
Once
40
14
Twice
7
2.5
Three or more
2
0.7
Nights spent in the hospital in the past 12 months
0
237
83.2
1–7
43
15.1
8–30
3
1.1
31 or more
2
0.7
Prescription of medicine use in past 12 months
Never taken
48
16.8
Ever taken, not always
148
51.9
(continued)
264
M. H. Ahmed and T. Abdullah AL Amri
Table 18 (continued)
Descriptive statistics
Kruskal–Wallis test
Ranks
Income
N
Mean rank
Health
insurance
0–5000
44
137.23
5000–10,000
52
136.23
10,000–15,000
96
153.02
15,000 or
more
93
139.18
Total
285
Test statistics
a,b
Health insurance
Chi-Square
3.001
df
3
Asymp. Sig. 0.391
a
Kruskal–Wallis test
Table 19 Frequency distribution according to sociodemographic
variables
Variables
Frequency N = 285
Percentage (%)
Health insurance
Yes
118
41.4
No
167
58.6
Age
20–29
72
25.3
30–39
136
47.7
40–49
52
18.2
50–64
25
8.8
Gender
Male
218
76.5
Female
67
23.5
Educational status
High school or less
57
20
College or more
228
80
Marital status
Married
219
76.8
Other
66
23.2
Income
0–5000
44
15.4
5000–10,000
52
18.2
10,000–15,000
96
33.7
(continued)
Table 19 (continued)
Variables
Frequency N = 285
Percentage (%)
15,000 or more
93
32.6
Nationality
Saudi
270
94.7
Other
15
5.3
Chronic disease
Yes
46
16.1
No
239
83.9
Health status
Good
259
90.9
Poor
26
9.1
Table 20 Frequency distribution according to utilization variables
Variables
Frequency N = 285
Percentage (%)
Dentist visit in the past 12 months
Nil
91
31.9
Once
74
26
Twice
85
20.4
Three or more
62
21.8
Medical providers visit in the past 12 months
Nil
25
8.8
Once
56
19.6
Twice
101
35.4
Three or more
103
36.1
Emergency Department visit in the past 12 months
Nil
134
47
Once
66
23.2
Twice
45
15.8
Three or more
40
14
Hospitalization in the past 12 months
Nil
236
82.8
Once
40
14
Twice
7
2.5
Three or more
2
0.7
Nights spent in the hospital in the past 12 months
0
237
83.2
1–7
43
15.1
8–30
3
1.1
31 or more
2
0.7
Prescription of medicine use in past 12 months
Never taken
48
16.8
Ever taken, not always
148
51.9
(continued)
264
M. H. Ahmed and T. Abdullah AL Amri