

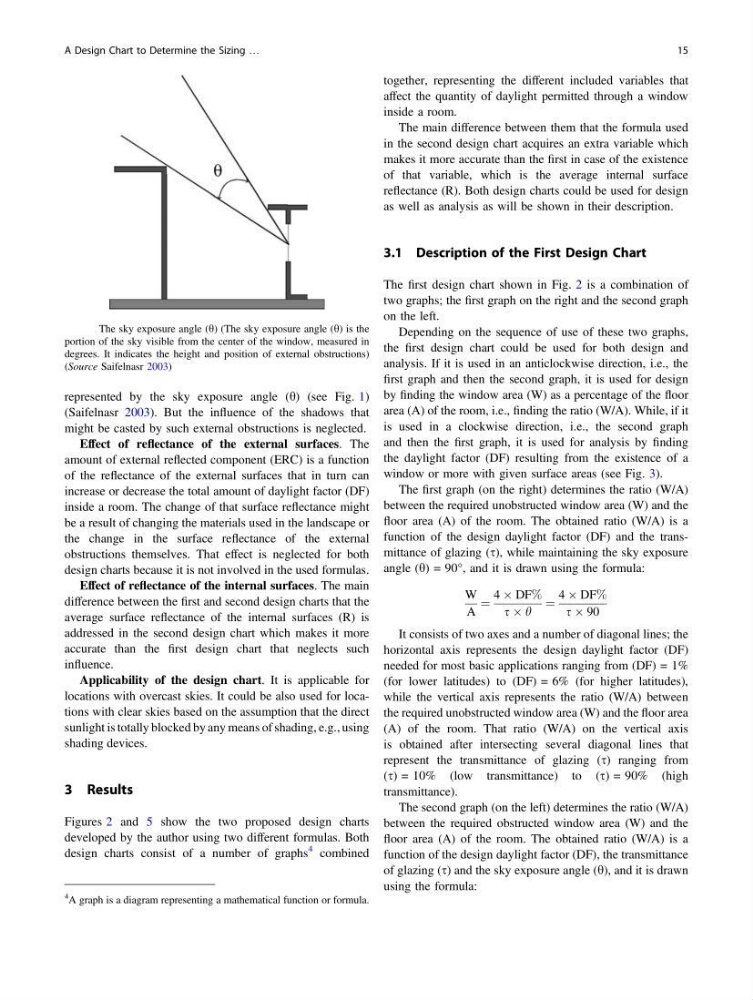
represented by the sky exposure angle (h) (see Fig. 1)
(Saifelnasr 2003). But the influence of the shadows that
might be casted by such external obstructions is neglected.
Effect of reflectance of the external surfaces. The
amount of external reflected component (ERC) is a function
of the reflectance of the external surfaces that in turn can
increase or decrease the total amount of daylight factor (DF)
inside a room. The change of that surface reflectance might
be a result of changing the materials used in the landscape or
the change in the surface reflectance of the external
obstructions themselves. That effect is neglected for both
design charts because it is not involved in the used formulas.
Effect of reflectance of the internal surfaces. The main
difference between the first and second design charts that the
average surface reflectance of the internal surfaces (R) is
addressed in the second design chart which makes it more
accurate than the first design chart that neglects such
influence.
Applicability of the design chart. It is applicable for
locations with overcast skies. It could be also used for locations with clear skies based on the assumption that the direct
sunlight is totally blocked by any means of shading, e.g., using
shading devices.
3 Results
Figures 2 and 5 show the two proposed design charts
developed by the author using two different formulas. Both
design charts consist of a number of graphs
4 combined
together, representing the different included variables that
affect the quantity of daylight permitted through a window
inside a room.
The main difference between them that the formula used
in the second design chart acquires an extra variable which
makes it more accurate than the first in case of the existence
of that variable, which is the average internal surface
reflectance (R). Both design charts could be used for design
as well as analysis as will be shown in their description.
3.1 Description of the First Design Chart
The first design chart shown in Fig. 2 is a combination of
two graphs; the first graph on the right and the second graph
on the left.
Depending on the sequence of use of these two graphs,
the first design chart could be used for both design and
analysis. If it is used in an anticlockwise direction, i.e., the
first graph and then the second graph, it is used for design
by finding the window area (W) as a percentage of the floor
area (A) of the room, i.e., finding the ratio (W/A). While, if it
is used in a clockwise direction, i.e., the second graph
and then the first graph, it is used for analysis by finding
the daylight factor (DF) resulting from the existence of a
window or more with given surface areas (see Fig. 3).
The first graph (on the right) determines the ratio (W/A)
between the required unobstructed window area (W) and the
floor area (A) of the room. The obtained ratio (W/A) is a
function of the design daylight factor (DF) and the transmittance of glazing (s), while maintaining the sky exposure
angle (h) = 90°, and it is drawn using the formula:
W
A
¼
4 Â DF%
s  h
¼
4 Â DF%
s  90
It consists of two axes and a number of diagonal lines; the
horizontal axis represents the design daylight factor (DF)
needed for most basic applications ranging from (DF) = 1%
(for lower latitudes) to (DF) = 6% (for higher latitudes),
while the vertical axis represents the ratio (W/A) between
the required unobstructed window area (W) and the floor area
(A) of the room. That ratio (W/A) on the vertical axis
is obtained after intersecting several diagonal lines that
represent the transmittance of glazing (s) ranging from
(s) = 10% (low transmittance) to (s) = 90% (high
transmittance).
The second graph (on the left) determines the ratio (W/A)
between the required obstructed window area (W) and the
floor area (A) of the room. The obtained ratio (W/A) is a
function of the design daylight factor (DF), the transmittance
of glazing (s) and the sky exposure angle (h), and it is drawn
using the formula:
Fig. 1 The sky exposure angle (h) (The sky exposure angle (h) is the
portion of the sky visible from the center of the window, measured in
degrees. It indicates the height and position of external obstructions)
(Source Saifelnasr 2003)
4
A graph is a diagram representing a mathematical function or formula.
A Design Chart to Determine the Sizing …
15
(Saifelnasr 2003). But the influence of the shadows that
might be casted by such external obstructions is neglected.
Effect of reflectance of the external surfaces. The
amount of external reflected component (ERC) is a function
of the reflectance of the external surfaces that in turn can
increase or decrease the total amount of daylight factor (DF)
inside a room. The change of that surface reflectance might
be a result of changing the materials used in the landscape or
the change in the surface reflectance of the external
obstructions themselves. That effect is neglected for both
design charts because it is not involved in the used formulas.
Effect of reflectance of the internal surfaces. The main
difference between the first and second design charts that the
average surface reflectance of the internal surfaces (R) is
addressed in the second design chart which makes it more
accurate than the first design chart that neglects such
influence.
Applicability of the design chart. It is applicable for
locations with overcast skies. It could be also used for locations with clear skies based on the assumption that the direct
sunlight is totally blocked by any means of shading, e.g., using
shading devices.
3 Results
Figures 2 and 5 show the two proposed design charts
developed by the author using two different formulas. Both
design charts consist of a number of graphs
4 combined
together, representing the different included variables that
affect the quantity of daylight permitted through a window
inside a room.
The main difference between them that the formula used
in the second design chart acquires an extra variable which
makes it more accurate than the first in case of the existence
of that variable, which is the average internal surface
reflectance (R). Both design charts could be used for design
as well as analysis as will be shown in their description.
3.1 Description of the First Design Chart
The first design chart shown in Fig. 2 is a combination of
two graphs; the first graph on the right and the second graph
on the left.
Depending on the sequence of use of these two graphs,
the first design chart could be used for both design and
analysis. If it is used in an anticlockwise direction, i.e., the
first graph and then the second graph, it is used for design
by finding the window area (W) as a percentage of the floor
area (A) of the room, i.e., finding the ratio (W/A). While, if it
is used in a clockwise direction, i.e., the second graph
and then the first graph, it is used for analysis by finding
the daylight factor (DF) resulting from the existence of a
window or more with given surface areas (see Fig. 3).
The first graph (on the right) determines the ratio (W/A)
between the required unobstructed window area (W) and the
floor area (A) of the room. The obtained ratio (W/A) is a
function of the design daylight factor (DF) and the transmittance of glazing (s), while maintaining the sky exposure
angle (h) = 90°, and it is drawn using the formula:
W
A
¼
4 Â DF%
s  h
¼
4 Â DF%
s  90
It consists of two axes and a number of diagonal lines; the
horizontal axis represents the design daylight factor (DF)
needed for most basic applications ranging from (DF) = 1%
(for lower latitudes) to (DF) = 6% (for higher latitudes),
while the vertical axis represents the ratio (W/A) between
the required unobstructed window area (W) and the floor area
(A) of the room. That ratio (W/A) on the vertical axis
is obtained after intersecting several diagonal lines that
represent the transmittance of glazing (s) ranging from
(s) = 10% (low transmittance) to (s) = 90% (high
transmittance).
The second graph (on the left) determines the ratio (W/A)
between the required obstructed window area (W) and the
floor area (A) of the room. The obtained ratio (W/A) is a
function of the design daylight factor (DF), the transmittance
of glazing (s) and the sky exposure angle (h), and it is drawn
using the formula:
Fig. 1 The sky exposure angle (h) (The sky exposure angle (h) is the
portion of the sky visible from the center of the window, measured in
degrees. It indicates the height and position of external obstructions)
(Source Saifelnasr 2003)
4
A graph is a diagram representing a mathematical function or formula.
A Design Chart to Determine the Sizing …
15