

100 Â 100 mm section dimensions and 500 mm length
were produced to conduct a 4-point flexural tensile test. The
tests have been conducted on day 56 to avoid the delay in
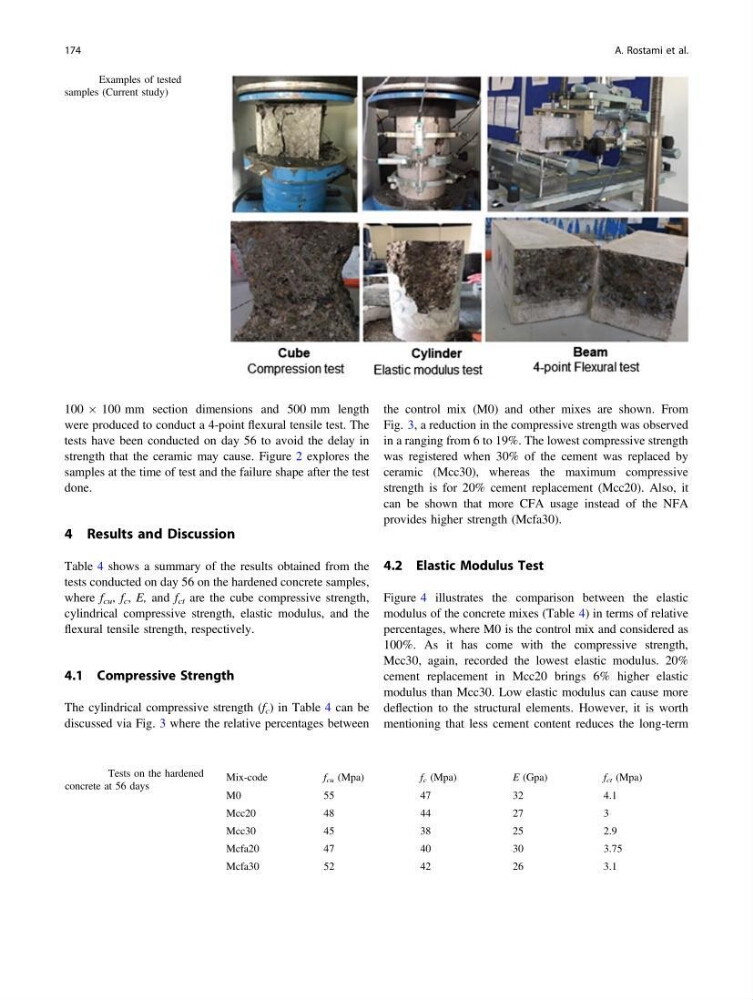
strength that the ceramic may cause. Figure 2 explores the
samples at the time of test and the failure shape after the test
done.
4 Results and Discussion
Table 4 shows a summary of the results obtained from the
tests conducted on day 56 on the hardened concrete samples,
where f cu , f c , E, and f ct are the cube compressive strength,
cylindrical compressive strength, elastic modulus, and the
flexural tensile strength, respectively.
4.1 Compressive Strength
The cylindrical compressive strength (f c ) in Table 4 can be
discussed via Fig. 3 where the relative percentages between
the control mix (M0) and other mixes are shown. From
Fig. 3, a reduction in the compressive strength was observed
in a ranging from 6 to 19%. The lowest compressive strength
was registered when 30% of the cement was replaced by
ceramic (Mcc30), whereas the maximum compressive
strength is for 20% cement replacement (Mcc20). Also, it
can be shown that more CFA usage instead of the NFA
provides higher strength (Mcfa30).
4.2 Elastic Modulus Test
Figure 4 illustrates the comparison between the elastic
modulus of the concrete mixes (Table 4) in terms of relative
percentages, where M0 is the control mix and considered as
100%. As it has come with the compressive strength,
Mcc30, again, recorded the lowest elastic modulus. 20%
cement replacement in Mcc20 brings 6% higher elastic
modulus than Mcc30. Low elastic modulus can cause more
deflection to the structural elements. However, it is worth
mentioning that less cement content reduces the long-term
Fig. 2 Examples of tested
samples (Current study)
Table 4 Tests on the hardened
concrete at 56 days
Mix-code
f cu (Mpa)
f c (Mpa)
E (Gpa)
f ct (Mpa)
M0
55
47
32
4.1
Mcc20
48
44
27
3
Mcc30
45
38
25
2.9
Mcfa20
47
40
30
3.75
Mcfa30
52
42
26
3.1
174
A. Rostami et al.
were produced to conduct a 4-point flexural tensile test. The
tests have been conducted on day 56 to avoid the delay in
strength that the ceramic may cause. Figure 2 explores the
samples at the time of test and the failure shape after the test
done.
4 Results and Discussion
Table 4 shows a summary of the results obtained from the
tests conducted on day 56 on the hardened concrete samples,
where f cu , f c , E, and f ct are the cube compressive strength,
cylindrical compressive strength, elastic modulus, and the
flexural tensile strength, respectively.
4.1 Compressive Strength
The cylindrical compressive strength (f c ) in Table 4 can be
discussed via Fig. 3 where the relative percentages between
the control mix (M0) and other mixes are shown. From
Fig. 3, a reduction in the compressive strength was observed
in a ranging from 6 to 19%. The lowest compressive strength
was registered when 30% of the cement was replaced by
ceramic (Mcc30), whereas the maximum compressive
strength is for 20% cement replacement (Mcc20). Also, it
can be shown that more CFA usage instead of the NFA
provides higher strength (Mcfa30).
4.2 Elastic Modulus Test
Figure 4 illustrates the comparison between the elastic
modulus of the concrete mixes (Table 4) in terms of relative
percentages, where M0 is the control mix and considered as
100%. As it has come with the compressive strength,
Mcc30, again, recorded the lowest elastic modulus. 20%
cement replacement in Mcc20 brings 6% higher elastic
modulus than Mcc30. Low elastic modulus can cause more
deflection to the structural elements. However, it is worth
mentioning that less cement content reduces the long-term
Fig. 2 Examples of tested
samples (Current study)
Table 4 Tests on the hardened
concrete at 56 days
Mix-code
f cu (Mpa)
f c (Mpa)
E (Gpa)
f ct (Mpa)
M0
55
47
32
4.1
Mcc20
48
44
27
3
Mcc30
45
38
25
2.9
Mcfa20
47
40
30
3.75
Mcfa30
52
42
26
3.1
174
A. Rostami et al.