

negative asymmetry. Altman’s EM Score, like all the traditional methods of assigning creditworthiness, due to the high
level of capitalization generally associated with farms,
returns a generally high and overestimated score compared
to the real conditions of economic and patrimonial equilibrium of companies; therefore, determining a low default risk
for most of the business structures. This is an important limit
that does not effectively assess companies with investment
portfolio; hence, with a high degree of indebtedness, which,
however, represent the core of productivity in the primary
sector (Mester 1997; Ferri and Lacitignola 2009; Latini
2004).
3 Research Questions
The main research question that reflects the purpose of this
article is addressed below:
“What would be the best operating rating model that
helps in improving the finance scheme of agricultural
companies?”
The answer of the above-said research question will be
found in the findings, Sect. 6.
The research question should be clear, concentrated,
short, and opens the discussion about a topic that is out of
interest to the reader. Moreover, the research question of this
article has helped the authors in concentrating on the core
research path enabling to reach a final result that is precise,
yet defensible https://marcushumanities12.weebly.com/
uploads/3/7/9/0/37903231/how_to_write_a_research_
question.pdf (2019).
4 Research Methodology and Methods
4.1 Research Philosophy
The research is positioned in the Epistemology stance and
conducted based on a positivism situation. Epistemology
deals with what is considered adequate information in the
studied area (Saunders et al. 2012). Since the studies was
built on an evidence-based reality that was mathematically
interpreted, positivism best would suit the purpose of this
research.
4.2 Research Strategy
This article used the quantitative research strategy because
the study is engaged in a quantification process, meaning
converting data into a numerical form. Additionally, the
authors are employed coding process after having collected
the data to identify the weights of the variables.
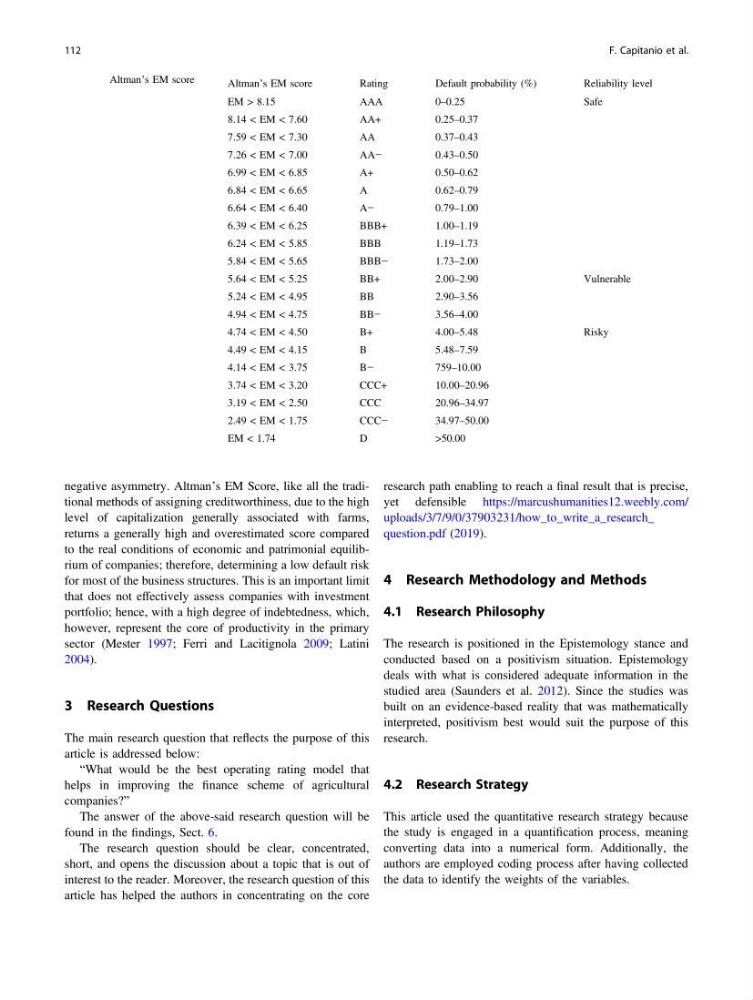
Table 2 Altman’s EM score
Altman’s EM score
Rating
Default probability (%)
Reliability level
EM > 8.15
AAA
0–0.25
Safe
8.14 < EM < 7.60
AA+
0.25–0.37
7.59 < EM < 7.30
AA
0.37–0.43
7.26 < EM < 7.00
AA−
0.43–0.50
6.99 < EM < 6.85
A+
0.50–0.62
6.84 < EM < 6.65
A
0.62–0.79
6.64 < EM < 6.40
A−
0.79–1.00
6.39 < EM < 6.25
BBB+
1.00–1.19
6.24 < EM < 5.85
BBB
1.19–1.73
5.84 < EM < 5.65
BBB−
1.73–2.00
5.64 < EM < 5.25
BB+
2.00–2.90
Vulnerable
5.24 < EM < 4.95
BB
2.90–3.56
4.94 < EM < 4.75
BB−
3.56–4.00
4.74 < EM < 4.50
B+
4.00–5.48
Risky
4.49 < EM < 4.15
B
5.48–7.59
4.14 < EM < 3.75
B−
759–10.00
3.74 < EM < 3.20
CCC+
10.00–20.96
3.19 < EM < 2.50
CCC
20.96–34.97
2.49 < EM < 1.75
CCC−
34.97–50.00
EM < 1.74
D
>50.00
112
F. Capitanio et al.
level of capitalization generally associated with farms,
returns a generally high and overestimated score compared
to the real conditions of economic and patrimonial equilibrium of companies; therefore, determining a low default risk
for most of the business structures. This is an important limit
that does not effectively assess companies with investment
portfolio; hence, with a high degree of indebtedness, which,
however, represent the core of productivity in the primary
sector (Mester 1997; Ferri and Lacitignola 2009; Latini
2004).
3 Research Questions
The main research question that reflects the purpose of this
article is addressed below:
“What would be the best operating rating model that
helps in improving the finance scheme of agricultural
companies?”
The answer of the above-said research question will be
found in the findings, Sect. 6.
The research question should be clear, concentrated,
short, and opens the discussion about a topic that is out of
interest to the reader. Moreover, the research question of this
article has helped the authors in concentrating on the core
research path enabling to reach a final result that is precise,
yet defensible https://marcushumanities12.weebly.com/
uploads/3/7/9/0/37903231/how_to_write_a_research_
question.pdf (2019).
4 Research Methodology and Methods
4.1 Research Philosophy
The research is positioned in the Epistemology stance and
conducted based on a positivism situation. Epistemology
deals with what is considered adequate information in the
studied area (Saunders et al. 2012). Since the studies was
built on an evidence-based reality that was mathematically
interpreted, positivism best would suit the purpose of this
research.
4.2 Research Strategy
This article used the quantitative research strategy because
the study is engaged in a quantification process, meaning
converting data into a numerical form. Additionally, the
authors are employed coding process after having collected
the data to identify the weights of the variables.
Table 2 Altman’s EM score
Altman’s EM score
Rating
Default probability (%)
Reliability level
EM > 8.15
AAA
0–0.25
Safe
8.14 < EM < 7.60
AA+
0.25–0.37
7.59 < EM < 7.30
AA
0.37–0.43
7.26 < EM < 7.00
AA−
0.43–0.50
6.99 < EM < 6.85
A+
0.50–0.62
6.84 < EM < 6.65
A
0.62–0.79
6.64 < EM < 6.40
A−
0.79–1.00
6.39 < EM < 6.25
BBB+
1.00–1.19
6.24 < EM < 5.85
BBB
1.19–1.73
5.84 < EM < 5.65
BBB−
1.73–2.00
5.64 < EM < 5.25
BB+
2.00–2.90
Vulnerable
5.24 < EM < 4.95
BB
2.90–3.56
4.94 < EM < 4.75
BB−
3.56–4.00
4.74 < EM < 4.50
B+
4.00–5.48
Risky
4.49 < EM < 4.15
B
5.48–7.59
4.14 < EM < 3.75
B−
759–10.00
3.74 < EM < 3.20
CCC+
10.00–20.96
3.19 < EM < 2.50
CCC
20.96–34.97
2.49 < EM < 1.75
CCC−
34.97–50.00
EM < 1.74
D
>50.00
112
F. Capitanio et al.