

• Section 5—Financial: average duration of loans: indebtedness index, degree of coverage; liquidity index; gross
operating margin on sales; change in revenues; changes
in inventories; average duration of debts; degree of net
coverage; Infinity amortization rate.
The main limitation of Moody’s model is the prevailing
weight that the Sects. 3, 4 and 5 assume with respect to the
synthetic judgment of value on the creditworthiness of the
companies. The possibility that the solvency of a farm
should necessarily depend on the management’s structure,
business and finance is a critical estimation, especially
because of the entrepreneurial structure of Italian agriculture
(Adinolfi and Capitanio 2009a, b, c):
In addition, there are other critical points of Moody’s
methodology can be found out in the small number of the
monitored sample, along with obvious problems in the
representation of the sample with respect to the farms’ universe and ex-post statistical verification of the implemented
model. Moreover, there are severe penalization rating opinions in the event of absence of replies from the farmer,
within the subjected questionnaire, with the result of finding
companies with a very robust economic/financial structure in
scales of reargued rating for this reason.
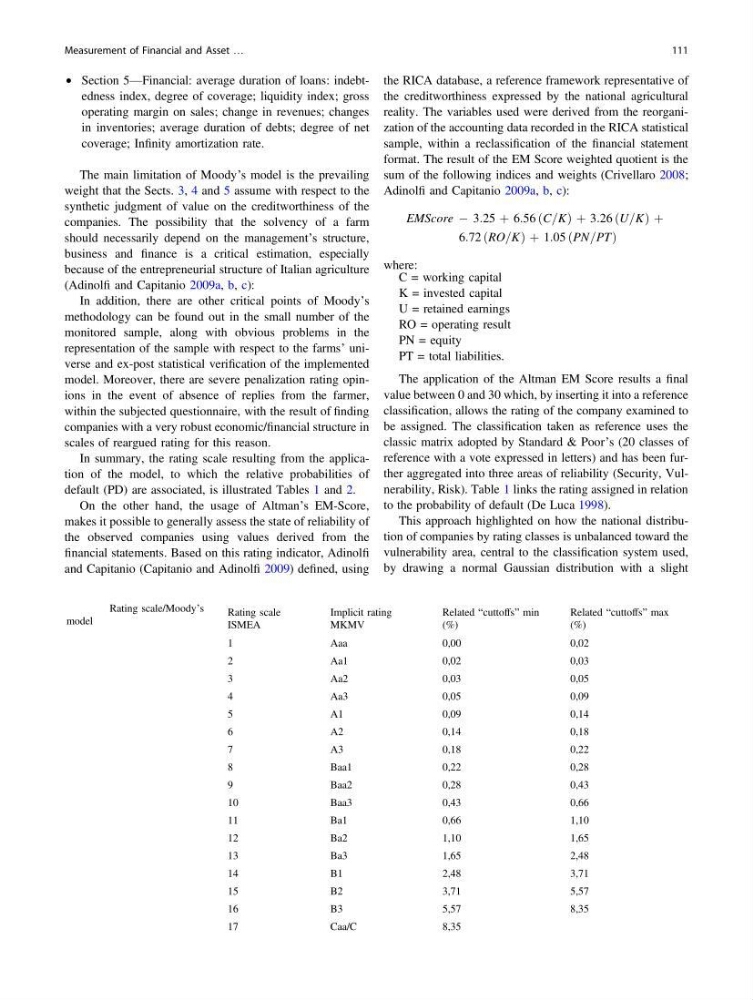
In summary, the rating scale resulting from the application of the model, to which the relative probabilities of
default (PD) are associated, is illustrated Tables 1 and 2.
On the other hand, the usage of Altman’s EM-Score,
makes it possible to generally assess the state of reliability of
the observed companies using values derived from the
financial statements. Based on this rating indicator, Adinolfi
and Capitanio (Capitanio and Adinolfi 2009) defined, using
the RICA database, a reference framework representative of
the creditworthiness expressed by the national agricultural
reality. The variables used were derived from the reorganization of the accounting data recorded in the RICA statistical
sample, within a reclassification of the financial statement
format. The result of the EM Score weighted quotient is the
sum of the following indices and weights (Crivellaro 2008;
Adinolfi and Capitanio 2009a, b, c):
EMScore À 3:25 þ 6:56 ðC=KÞ þ 3:26 ðU=KÞ þ
6:72 ðRO=KÞ þ 1:05 ðPN=PTÞ
where:
C = working capital
K = invested capital
U = retained earnings
RO = operating result
PN = equity
PT = total liabilities.
The application of the Altman EM Score results a final
value between 0 and 30 which, by inserting it into a reference
classification, allows the rating of the company examined to
be assigned. The classification taken as reference uses the
classic matrix adopted by Standard & Poor’s (20 classes of
reference with a vote expressed in letters) and has been further aggregated into three areas of reliability (Security, Vulnerability, Risk). Table 1 links the rating assigned in relation
to the probability of default (De Luca 1998).
This approach highlighted on how the national distribution of companies by rating classes is unbalanced toward the
vulnerability area, central to the classification system used,
by drawing a normal Gaussian distribution with a slight
Table 1 Rating scale/Moody’s
model
Rating scale
ISMEA
Implicit rating
MKMV
Related “cuttoffs” min
(%)
Related “cuttoffs” max
(%)
1
Aaa
0,00
0,02
2
Aa1
0,02
0,03
3
Aa2
0,03
0,05
4
Aa3
0,05
0,09
5
A1
0,09
0,14
6
A2
0,14
0,18
7
A3
0,18
0,22
8
Baa1
0,22
0,28
9
Baa2
0,28
0,43
10
Baa3
0,43
0,66
11
Ba1
0,66
1,10
12
Ba2
1,10
1,65
13
Ba3
1,65
2,48
14
B1
2,48
3,71
15
B2
3,71
5,57
16
B3
5,57
8,35
17
Caa/C
8,35
Measurement of Financial and Asset …
111
operating margin on sales; change in revenues; changes
in inventories; average duration of debts; degree of net
coverage; Infinity amortization rate.
The main limitation of Moody’s model is the prevailing
weight that the Sects. 3, 4 and 5 assume with respect to the
synthetic judgment of value on the creditworthiness of the
companies. The possibility that the solvency of a farm
should necessarily depend on the management’s structure,
business and finance is a critical estimation, especially
because of the entrepreneurial structure of Italian agriculture
(Adinolfi and Capitanio 2009a, b, c):
In addition, there are other critical points of Moody’s
methodology can be found out in the small number of the
monitored sample, along with obvious problems in the
representation of the sample with respect to the farms’ universe and ex-post statistical verification of the implemented
model. Moreover, there are severe penalization rating opinions in the event of absence of replies from the farmer,
within the subjected questionnaire, with the result of finding
companies with a very robust economic/financial structure in
scales of reargued rating for this reason.
In summary, the rating scale resulting from the application of the model, to which the relative probabilities of
default (PD) are associated, is illustrated Tables 1 and 2.
On the other hand, the usage of Altman’s EM-Score,
makes it possible to generally assess the state of reliability of
the observed companies using values derived from the
financial statements. Based on this rating indicator, Adinolfi
and Capitanio (Capitanio and Adinolfi 2009) defined, using
the RICA database, a reference framework representative of
the creditworthiness expressed by the national agricultural
reality. The variables used were derived from the reorganization of the accounting data recorded in the RICA statistical
sample, within a reclassification of the financial statement
format. The result of the EM Score weighted quotient is the
sum of the following indices and weights (Crivellaro 2008;
Adinolfi and Capitanio 2009a, b, c):
EMScore À 3:25 þ 6:56 ðC=KÞ þ 3:26 ðU=KÞ þ
6:72 ðRO=KÞ þ 1:05 ðPN=PTÞ
where:
C = working capital
K = invested capital
U = retained earnings
RO = operating result
PN = equity
PT = total liabilities.
The application of the Altman EM Score results a final
value between 0 and 30 which, by inserting it into a reference
classification, allows the rating of the company examined to
be assigned. The classification taken as reference uses the
classic matrix adopted by Standard & Poor’s (20 classes of
reference with a vote expressed in letters) and has been further aggregated into three areas of reliability (Security, Vulnerability, Risk). Table 1 links the rating assigned in relation
to the probability of default (De Luca 1998).
This approach highlighted on how the national distribution of companies by rating classes is unbalanced toward the
vulnerability area, central to the classification system used,
by drawing a normal Gaussian distribution with a slight
Table 1 Rating scale/Moody’s
model
Rating scale
ISMEA
Implicit rating
MKMV
Related “cuttoffs” min
(%)
Related “cuttoffs” max
(%)
1
Aaa
0,00
0,02
2
Aa1
0,02
0,03
3
Aa2
0,03
0,05
4
Aa3
0,05
0,09
5
A1
0,09
0,14
6
A2
0,14
0,18
7
A3
0,18
0,22
8
Baa1
0,22
0,28
9
Baa2
0,28
0,43
10
Baa3
0,43
0,66
11
Ba1
0,66
1,10
12
Ba2
1,10
1,65
13
Ba3
1,65
2,48
14
B1
2,48
3,71
15
B2
3,71
5,57
16
B3
5,57
8,35
17
Caa/C
8,35
Measurement of Financial and Asset …
111