

5.3 Applications in the Landslide Experiments
69
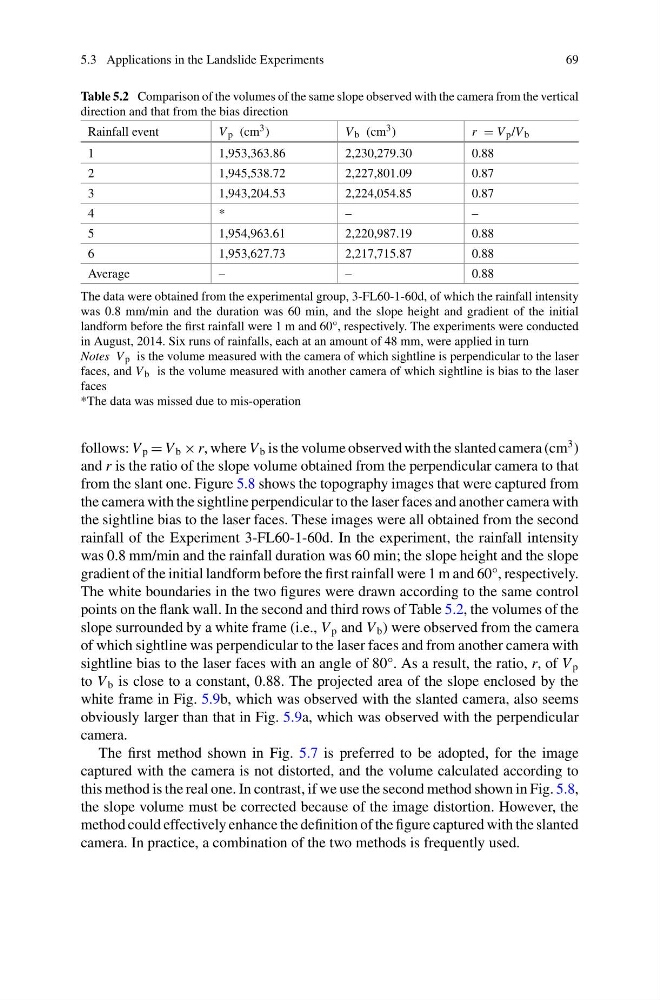
Table 5.2 Comparison of the volumes of the same slope observed with the camera from the vertical
direction and that from the bias direction
Rainfall event
V p (cm 3 )
V b (cm 3 )
r = V p /V b
1
1,953,363.86
2,230,279.30
0.88
2
1,945,538.72
2,227,801.09
0.87
3
1,943,204.53
2,224,054.85
0.87
4
*
–
–
5
1,954,963.61
2,220,987.19
0.88
6
1,953,627.73
2,217,715.87
0.88
Average
–
–
0.88
The data were obtained from the experimental group, 3-FL60-1-60d, of which the rainfall intensity
was 0.8 mm/min and the duration was 60 min, and the slope height and gradient of the initial
landform before the first rainfall were 1 m and 60°, respectively. The experiments were conducted
in August, 2014. Six runs of rainfalls, each at an amount of 48 mm, were applied in turn
Notes V p is the volume measured with the camera of which sightline is perpendicular to the laser
faces, and V b is the volume measured with another camera of which sightline is bias to the laser
faces
*The data was missed due to mis-operation
follows: V p = V b × r, where V b is the volume observed with the slanted camera (cm
3 )
and r is the ratio of the slope volume obtained from the perpendicular camera to that
from the slant one. Figure 5.8 shows the topography images that were captured from
the camera with the sightline perpendicular to the laser faces and another camera with
the sightline bias to the laser faces. These images were all obtained from the second
rainfall of the Experiment 3-FL60-1-60d. In the experiment, the rainfall intensity
was 0.8 mm/min and the rainfall duration was 60 min; the slope height and the slope
gradient of the initial landform before the first rainfall were 1 m and 60°, respectively.
The white boundaries in the two figures were drawn according to the same control
points on the flank wall. In the second and third rows of Table 5.2, the volumes of the
slope surrounded by a white frame (i.e., V p and V b ) were observed from the camera
of which sightline was perpendicular to the laser faces and from another camera with
sightline bias to the laser faces with an angle of 80°. As a result, the ratio, r, of V p
to V b is close to a constant, 0.88. The projected area of the slope enclosed by the
white frame in Fig. 5.9b, which was observed with the slanted camera, also seems
obviously larger than that in Fig. 5.9a, which was observed with the perpendicular
camera.
The first method shown in Fig. 5.7 is preferred to be adopted, for the image
captured with the camera is not distorted, and the volume calculated according to
this method is the real one. In contrast, if we use the second method shown in Fig. 5.8,
the slope volume must be corrected because of the image distortion. However, the
method could effectively enhance the definition of the figure captured with the slanted
camera. In practice, a combination of the two methods is frequently used.
69
Table 5.2 Comparison of the volumes of the same slope observed with the camera from the vertical
direction and that from the bias direction
Rainfall event
V p (cm 3 )
V b (cm 3 )
r = V p /V b
1
1,953,363.86
2,230,279.30
0.88
2
1,945,538.72
2,227,801.09
0.87
3
1,943,204.53
2,224,054.85
0.87
4
*
–
–
5
1,954,963.61
2,220,987.19
0.88
6
1,953,627.73
2,217,715.87
0.88
Average
–
–
0.88
The data were obtained from the experimental group, 3-FL60-1-60d, of which the rainfall intensity
was 0.8 mm/min and the duration was 60 min, and the slope height and gradient of the initial
landform before the first rainfall were 1 m and 60°, respectively. The experiments were conducted
in August, 2014. Six runs of rainfalls, each at an amount of 48 mm, were applied in turn
Notes V p is the volume measured with the camera of which sightline is perpendicular to the laser
faces, and V b is the volume measured with another camera of which sightline is bias to the laser
faces
*The data was missed due to mis-operation
follows: V p = V b × r, where V b is the volume observed with the slanted camera (cm
3 )
and r is the ratio of the slope volume obtained from the perpendicular camera to that
from the slant one. Figure 5.8 shows the topography images that were captured from
the camera with the sightline perpendicular to the laser faces and another camera with
the sightline bias to the laser faces. These images were all obtained from the second
rainfall of the Experiment 3-FL60-1-60d. In the experiment, the rainfall intensity
was 0.8 mm/min and the rainfall duration was 60 min; the slope height and the slope
gradient of the initial landform before the first rainfall were 1 m and 60°, respectively.
The white boundaries in the two figures were drawn according to the same control
points on the flank wall. In the second and third rows of Table 5.2, the volumes of the
slope surrounded by a white frame (i.e., V p and V b ) were observed from the camera
of which sightline was perpendicular to the laser faces and from another camera with
sightline bias to the laser faces with an angle of 80°. As a result, the ratio, r, of V p
to V b is close to a constant, 0.88. The projected area of the slope enclosed by the
white frame in Fig. 5.9b, which was observed with the slanted camera, also seems
obviously larger than that in Fig. 5.9a, which was observed with the perpendicular
camera.
The first method shown in Fig. 5.7 is preferred to be adopted, for the image
captured with the camera is not distorted, and the volume calculated according to
this method is the real one. In contrast, if we use the second method shown in Fig. 5.8,
the slope volume must be corrected because of the image distortion. However, the
method could effectively enhance the definition of the figure captured with the slanted
camera. In practice, a combination of the two methods is frequently used.