

26
2 Similarity of Model Experiments
0
20
40
60
80
0
100
200
300
400
Distance from the outlet , L m (cm)
Elevation , H
m (cm)
N m (0)
N m (1)
N m (2)
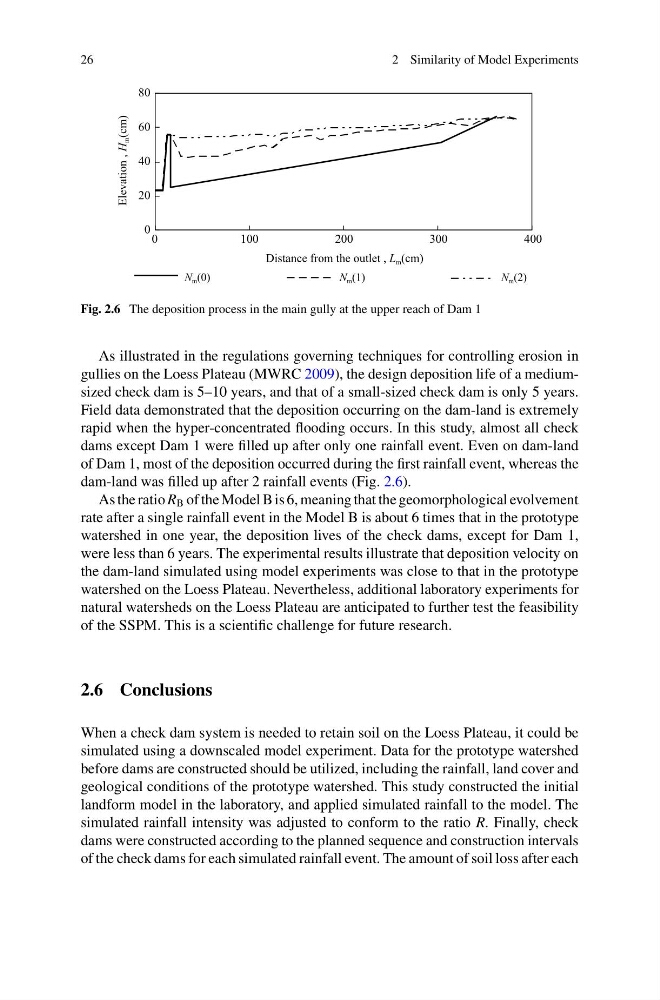
Fig. 2.6 The deposition process in the main gully at the upper reach of Dam 1
As illustrated in the regulations governing techniques for controlling erosion in
gullies on the Loess Plateau (MWRC 2009), the design deposition life of a mediumsized check dam is 5–10 years, and that of a small-sized check dam is only 5 years.
Field data demonstrated that the deposition occurring on the dam-land is extremely
rapid when the hyper-concentrated flooding occurs. In this study, almost all check
dams except Dam 1 were filled up after only one rainfall event. Even on dam-land
of Dam 1, most of the deposition occurred during the first rainfall event, whereas the
dam-land was filled up after 2 rainfall events (Fig. 2.6).
As the ratio R B of the Model B is 6, meaning that the geomorphological evolvement
rate after a single rainfall event in the Model B is about 6 times that in the prototype
watershed in one year, the deposition lives of the check dams, except for Dam 1,
were less than 6 years. The experimental results illustrate that deposition velocity on
the dam-land simulated using model experiments was close to that in the prototype
watershed on the Loess Plateau. Nevertheless, additional laboratory experiments for
natural watersheds on the Loess Plateau are anticipated to further test the feasibility
of the SSPM. This is a scientific challenge for future research.
2.6 Conclusions
When a check dam system is needed to retain soil on the Loess Plateau, it could be
simulated using a downscaled model experiment. Data for the prototype watershed
before dams are constructed should be utilized, including the rainfall, land cover and
geological conditions of the prototype watershed. This study constructed the initial
landform model in the laboratory, and applied simulated rainfall to the model. The
simulated rainfall intensity was adjusted to conform to the ratio R. Finally, check
dams were constructed according to the planned sequence and construction intervals
of the check dams for each simulated rainfall event. The amount of soil loss after each
2 Similarity of Model Experiments
0
20
40
60
80
0
100
200
300
400
Distance from the outlet , L m (cm)
Elevation , H
m (cm)
N m (0)
N m (1)
N m (2)
Fig. 2.6 The deposition process in the main gully at the upper reach of Dam 1
As illustrated in the regulations governing techniques for controlling erosion in
gullies on the Loess Plateau (MWRC 2009), the design deposition life of a mediumsized check dam is 5–10 years, and that of a small-sized check dam is only 5 years.
Field data demonstrated that the deposition occurring on the dam-land is extremely
rapid when the hyper-concentrated flooding occurs. In this study, almost all check
dams except Dam 1 were filled up after only one rainfall event. Even on dam-land
of Dam 1, most of the deposition occurred during the first rainfall event, whereas the
dam-land was filled up after 2 rainfall events (Fig. 2.6).
As the ratio R B of the Model B is 6, meaning that the geomorphological evolvement
rate after a single rainfall event in the Model B is about 6 times that in the prototype
watershed in one year, the deposition lives of the check dams, except for Dam 1,
were less than 6 years. The experimental results illustrate that deposition velocity on
the dam-land simulated using model experiments was close to that in the prototype
watershed on the Loess Plateau. Nevertheless, additional laboratory experiments for
natural watersheds on the Loess Plateau are anticipated to further test the feasibility
of the SSPM. This is a scientific challenge for future research.
2.6 Conclusions
When a check dam system is needed to retain soil on the Loess Plateau, it could be
simulated using a downscaled model experiment. Data for the prototype watershed
before dams are constructed should be utilized, including the rainfall, land cover and
geological conditions of the prototype watershed. This study constructed the initial
landform model in the laboratory, and applied simulated rainfall to the model. The
simulated rainfall intensity was adjusted to conform to the ratio R. Finally, check
dams were constructed according to the planned sequence and construction intervals
of the check dams for each simulated rainfall event. The amount of soil loss after each