

2.5 Results and Discussion
25
models was less than 55% (Table 2.4), except for the second rainfall event with the
soil loss error of 81.2%.
The precision in predicting the effect of sediment retained in the models was sufficiently good for the model experiments on soil conservation. It could be concluded
that the experimental method can be used to predict the volume of soil loss in the
small watershed of the Loess Plateau.
2.5.4 Qualitative Analysis of Erosion Depth
To compare the erosion trends in the model gullies with those in the prototype,
the mean gully elevation in the Model Da and Model Db after each rainfall event
was converted to that in the Model B using the scale-modification method. Notably,
if the Model B is regarded as the simulated “prototype” and the Model Da as the
downscaled model, then the length scale number is 4, and the soil erosion/deposition
depth scale number is 1.6. However, if the Model B is considered as the simulated
“prototype” and the Model Db as the downscaled model, the length scale number is
4, and the soil erosion/deposition depth scale number is 3.5.
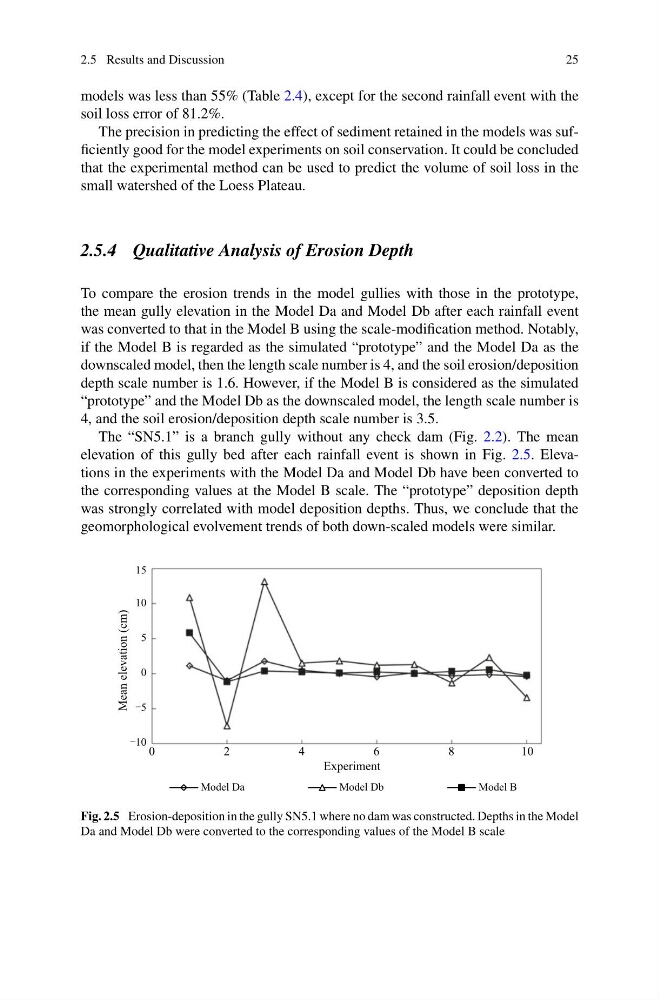
The “SN5.1” is a branch gully without any check dam (Fig. 2.2). The mean
elevation of this gully bed after each rainfall event is shown in Fig. 2.5. Elevations in the experiments with the Model Da and Model Db have been converted to
the corresponding values at the Model B scale. The “prototype” deposition depth
was strongly correlated with model deposition depths. Thus, we conclude that the
geomorphological evolvement trends of both down-scaled models were similar.
0
5
10
15
0
2
4
6
8
1 0
Mean elevation (cm)
Experiment
Model Da
Model Db
Model B
Fig. 2.5 Erosion-deposition in the gully SN5.1 where no dam was constructed. Depths in the Model
Da and Model Db were converted to the corresponding values of the Model B scale
25
models was less than 55% (Table 2.4), except for the second rainfall event with the
soil loss error of 81.2%.
The precision in predicting the effect of sediment retained in the models was sufficiently good for the model experiments on soil conservation. It could be concluded
that the experimental method can be used to predict the volume of soil loss in the
small watershed of the Loess Plateau.
2.5.4 Qualitative Analysis of Erosion Depth
To compare the erosion trends in the model gullies with those in the prototype,
the mean gully elevation in the Model Da and Model Db after each rainfall event
was converted to that in the Model B using the scale-modification method. Notably,
if the Model B is regarded as the simulated “prototype” and the Model Da as the
downscaled model, then the length scale number is 4, and the soil erosion/deposition
depth scale number is 1.6. However, if the Model B is considered as the simulated
“prototype” and the Model Db as the downscaled model, the length scale number is
4, and the soil erosion/deposition depth scale number is 3.5.
The “SN5.1” is a branch gully without any check dam (Fig. 2.2). The mean
elevation of this gully bed after each rainfall event is shown in Fig. 2.5. Elevations in the experiments with the Model Da and Model Db have been converted to
the corresponding values at the Model B scale. The “prototype” deposition depth
was strongly correlated with model deposition depths. Thus, we conclude that the
geomorphological evolvement trends of both down-scaled models were similar.
0
5
10
15
0
2
4
6
8
1 0
Mean elevation (cm)
Experiment
Model Da
Model Db
Model B
Fig. 2.5 Erosion-deposition in the gully SN5.1 where no dam was constructed. Depths in the Model
Da and Model Db were converted to the corresponding values of the Model B scale