

220
13 Tunnel Flow and Erosion Processes …
0
10
20
30
40
I (mm/ h)
Rainfall
0
100
200
300
400
500
0
0.5
1
1.5
2
2.5
3
0
0.2
0.4
0.6
0.8
1
1.2
Sc (g/l)
Q (l/s)
Time (h)
Tunnel 4
Q (l/s)
Sc (g/l)
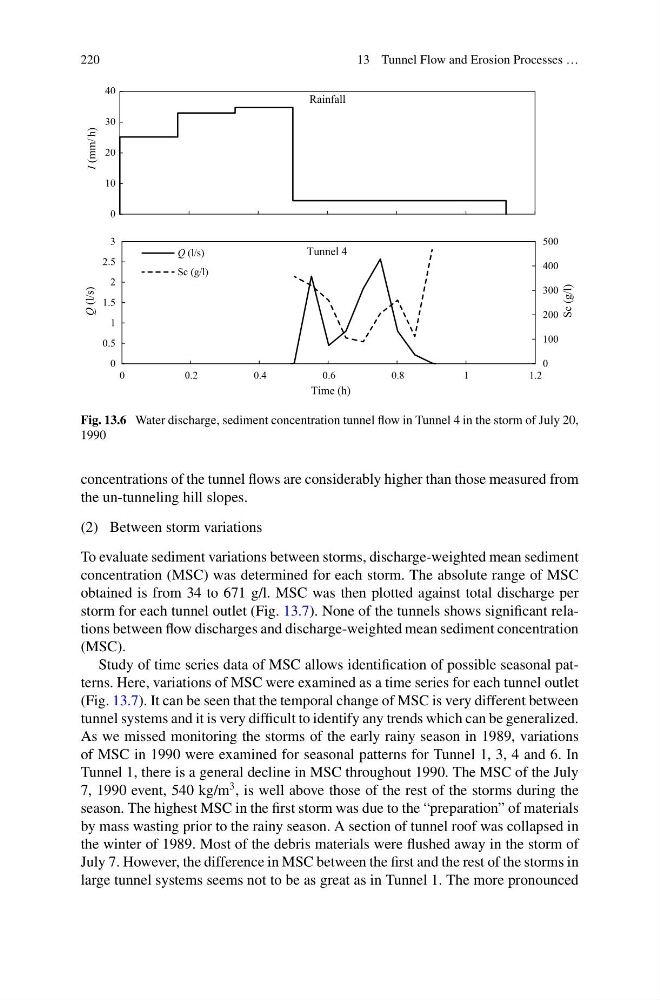
Fig. 13.6 Water discharge, sediment concentration tunnel flow in Tunnel 4 in the storm of July 20,
1990
concentrations of the tunnel flows are considerably higher than those measured from
the un-tunneling hill slopes.
(2) Between storm variations
To evaluate sediment variations between storms, discharge-weighted mean sediment
concentration (MSC) was determined for each storm. The absolute range of MSC
obtained is from 34 to 671 g/l. MSC was then plotted against total discharge per
storm for each tunnel outlet (Fig. 13.7). None of the tunnels shows significant relations between flow discharges and discharge-weighted mean sediment concentration
(MSC).
Study of time series data of MSC allows identification of possible seasonal patterns. Here, variations of MSC were examined as a time series for each tunnel outlet
(Fig. 13.7). It can be seen that the temporal change of MSC is very different between
tunnel systems and it is very difficult to identify any trends which can be generalized.
As we missed monitoring the storms of the early rainy season in 1989, variations
of MSC in 1990 were examined for seasonal patterns for Tunnel 1, 3, 4 and 6. In
Tunnel 1, there is a general decline in MSC throughout 1990. The MSC of the July
7, 1990 event, 540 kg/m
3 , is well above those of the rest of the storms during the
season. The highest MSC in the first storm was due to the “preparation” of materials
by mass wasting prior to the rainy season. A section of tunnel roof was collapsed in
the winter of 1989. Most of the debris materials were flushed away in the storm of
July 7. However, the difference in MSC between the first and the rest of the storms in
large tunnel systems seems not to be as great as in Tunnel 1. The more pronounced
13 Tunnel Flow and Erosion Processes …
0
10
20
30
40
I (mm/ h)
Rainfall
0
100
200
300
400
500
0
0.5
1
1.5
2
2.5
3
0
0.2
0.4
0.6
0.8
1
1.2
Sc (g/l)
Q (l/s)
Time (h)
Tunnel 4
Q (l/s)
Sc (g/l)
Fig. 13.6 Water discharge, sediment concentration tunnel flow in Tunnel 4 in the storm of July 20,
1990
concentrations of the tunnel flows are considerably higher than those measured from
the un-tunneling hill slopes.
(2) Between storm variations
To evaluate sediment variations between storms, discharge-weighted mean sediment
concentration (MSC) was determined for each storm. The absolute range of MSC
obtained is from 34 to 671 g/l. MSC was then plotted against total discharge per
storm for each tunnel outlet (Fig. 13.7). None of the tunnels shows significant relations between flow discharges and discharge-weighted mean sediment concentration
(MSC).
Study of time series data of MSC allows identification of possible seasonal patterns. Here, variations of MSC were examined as a time series for each tunnel outlet
(Fig. 13.7). It can be seen that the temporal change of MSC is very different between
tunnel systems and it is very difficult to identify any trends which can be generalized.
As we missed monitoring the storms of the early rainy season in 1989, variations
of MSC in 1990 were examined for seasonal patterns for Tunnel 1, 3, 4 and 6. In
Tunnel 1, there is a general decline in MSC throughout 1990. The MSC of the July
7, 1990 event, 540 kg/m
3 , is well above those of the rest of the storms during the
season. The highest MSC in the first storm was due to the “preparation” of materials
by mass wasting prior to the rainy season. A section of tunnel roof was collapsed in
the winter of 1989. Most of the debris materials were flushed away in the storm of
July 7. However, the difference in MSC between the first and the rest of the storms in
large tunnel systems seems not to be as great as in Tunnel 1. The more pronounced