

180
11 Detecting Fingerprints of Gravity Erosion Drivers …
large-scale mass failures, the peak events occurred during the third or fourth rainfall
events for five runs of rainfalls in each experiment.
The effect of rainfall duration was also investigated by varying the rainfall duration
from 30 to 60 min, while the rainfall intensity was kept constant at 0.8 mm/min.
Figure 11.4a portrays the changes of the aforementioned failure scars as the rainfall
duration increased. The number of gravity erosions corresponding to the Tf, Uc
and Dc were increased, among which Tf was significantly augmented by 400%,
while gravity erosions with the scars Co and Ps were reduced by more than 50%.
Meanwhile, the volumes of gravity erosions corresponding to the scars Tf, Uc and
Co were increased by 338, 1236 and 376%, respectively, but no substantial change
occurred in the failures with the scars Dc and Ps. In other words, the change of
volumes for different scars was tremendous, and the volume of the Uc-shaped failure
underwent a significant increase.
Rainfall intensity also has a direct impact on gravity erosion. Inspection of
Fig. 11.4b revealed that there had been a very substantial increase in the total number
or amount of gravity erosions corresponding to three major types of scars (i.e., Tf,
Uc, and Dc) when the rainfall duration was kept constant at 30 min but the rainfall
intensity was increased from 0.8 to 2.0 mm/min. In particular, the volume of gravity
erosion for the scar Tf was augmented by 553%. This increase indicates that rainfall
intensity significantly influenced the size and frequency of gravity erosion of the
major scars. In contrast, the changes in the gravity erosion corresponding to the scars
Co, Ps, and Ia were not statistically significant.
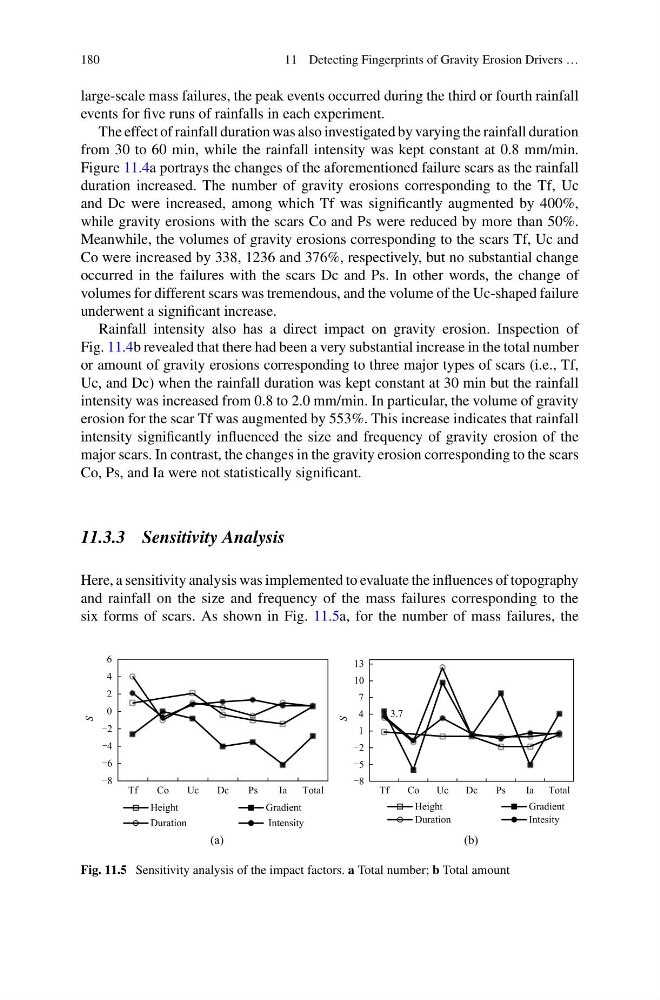
11.3.3 Sensitivity Analysis
Here, a sensitivity analysis was implemented to evaluate the influences of topography
and rainfall on the size and frequency of the mass failures corresponding to the
six forms of scars. As shown in Fig. 11.5a, for the number of mass failures, the
-8
-6
-4
-2
0
2
4
6
Tf
Co
Uc
Dc
Ps
Ia
Total
S
(a)
Height
Gradient
Duration
Intensity
3.7
-8
-5
-2
1
4
7
10
13
Tf
Co
Uc
Dc
Ps
Ia Total
S
(b)
Height
Gradient
Duration
Intesity
Fig. 11.5 Sensitivity analysis of the impact factors. a Total number; b Total amount
11 Detecting Fingerprints of Gravity Erosion Drivers …
large-scale mass failures, the peak events occurred during the third or fourth rainfall
events for five runs of rainfalls in each experiment.
The effect of rainfall duration was also investigated by varying the rainfall duration
from 30 to 60 min, while the rainfall intensity was kept constant at 0.8 mm/min.
Figure 11.4a portrays the changes of the aforementioned failure scars as the rainfall
duration increased. The number of gravity erosions corresponding to the Tf, Uc
and Dc were increased, among which Tf was significantly augmented by 400%,
while gravity erosions with the scars Co and Ps were reduced by more than 50%.
Meanwhile, the volumes of gravity erosions corresponding to the scars Tf, Uc and
Co were increased by 338, 1236 and 376%, respectively, but no substantial change
occurred in the failures with the scars Dc and Ps. In other words, the change of
volumes for different scars was tremendous, and the volume of the Uc-shaped failure
underwent a significant increase.
Rainfall intensity also has a direct impact on gravity erosion. Inspection of
Fig. 11.4b revealed that there had been a very substantial increase in the total number
or amount of gravity erosions corresponding to three major types of scars (i.e., Tf,
Uc, and Dc) when the rainfall duration was kept constant at 30 min but the rainfall
intensity was increased from 0.8 to 2.0 mm/min. In particular, the volume of gravity
erosion for the scar Tf was augmented by 553%. This increase indicates that rainfall
intensity significantly influenced the size and frequency of gravity erosion of the
major scars. In contrast, the changes in the gravity erosion corresponding to the scars
Co, Ps, and Ia were not statistically significant.
11.3.3 Sensitivity Analysis
Here, a sensitivity analysis was implemented to evaluate the influences of topography
and rainfall on the size and frequency of the mass failures corresponding to the
six forms of scars. As shown in Fig. 11.5a, for the number of mass failures, the
-8
-6
-4
-2
0
2
4
6
Tf
Co
Uc
Dc
Ps
Ia
Total
S
(a)
Height
Gradient
Duration
Intensity
3.7
-8
-5
-2
1
4
7
10
13
Tf
Co
Uc
Dc
Ps
Ia Total
S
(b)
Height
Gradient
Duration
Intesity
Fig. 11.5 Sensitivity analysis of the impact factors. a Total number; b Total amount