

11.3 Results and Discussion
179
total number of Uc scars was enhanced by 105%, and the mass failure with the scar
Dc was reduced by 19%, but their amounts did not change significantly. In addition,
the total number and amount of mass failures corresponding to the scars Ps and Ia
were decreased by more than 50%. However, for a slope with the height of 1.0 m or
1.5 m, the probability of the Co scar occurrence was low in two-group comparisons.
Slope gradient also has an important influence on the distribution of the scar
morphologies. As shown in Fig. 11.3b, when other parameters were fixed but the
slope gradient was increased by 14% (i.e., the slope gradient was increased from
70° to 80°), the total numbers of mass failures for the six different types of scars
mentioned above were decreased, whereas their volumes were increased, with the
exception of Co and Ia scars that were reduced. This phenomenon can be attributed
to the following two reasons. First, the increased slope gradient caused the bad
infiltration on the slope face, in turn resulting in a lower frequency of mass failures
for the scars. Table 11.1 provides strong evidence that the occurrence frequency of
mass failure was decreased as the slope gradient increased. For the gully banks with
a slope of 70° (i.e., the experiments L1, 3, 5, 7 and 9), the total number of mass
failures was 182, while for those with a slope of 80° (i.e., the experiments L2, 4,
6, 8 and 10), the total number of mass failures was 116. Second, the slope stability
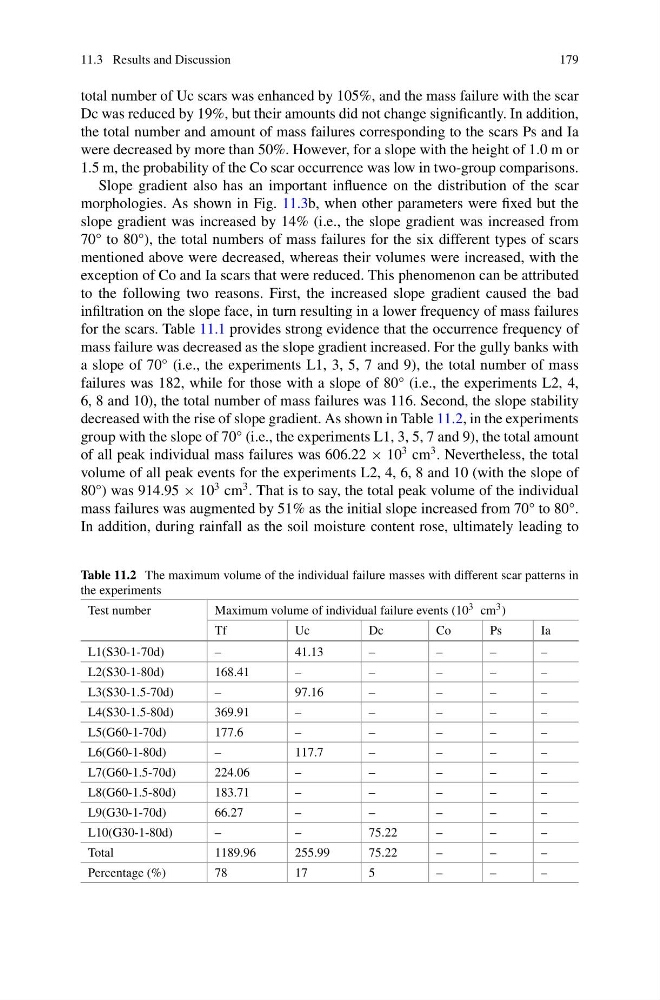
decreased with the rise of slope gradient. As shown in Table 11.2, in the experiments
group with the slope of 70° (i.e., the experiments L1, 3, 5, 7 and 9), the total amount
of all peak individual mass failures was 606.22 × 10
3 cm
3 . Nevertheless, the total
volume of all peak events for the experiments L2, 4, 6, 8 and 10 (with the slope of
80°) was 914.95 × 10
3 cm
3 . That is to say, the total peak volume of the individual
mass failures was augmented by 51% as the initial slope increased from 70° to 80°.
In addition, during rainfall as the soil moisture content rose, ultimately leading to
Table 11.2 The maximum volume of the individual failure masses with different scar patterns in
the experiments
Test number
Maximum volume of individual failure events (10 3 cm 3 )
Tf
Uc
Dc
Co
Ps
Ia
L1(S30-1-70d)
–
41.13
–
–
–
–
L2(S30-1-80d)
168.41
–
–
–
–
–
L3(S30-1.5-70d)
–
97.16
–
–
–
–
L4(S30-1.5-80d)
369.91
–
–
–
–
–
L5(G60-1-70d)
177.6
–
–
–
–
–
L6(G60-1-80d)
–
117.7
–
–
–
–
L7(G60-1.5-70d)
224.06
–
–
–
–
–
L8(G60-1.5-80d)
183.71
–
–
–
–
–
L9(G30-1-70d)
66.27
–
–
–
–
–
L10(G30-1-80d)
–
–
75.22
–
–
–
Total
1189.96
255.99
75.22
–
–
–
Percentage (%)
78
17
5
–
–
–
179
total number of Uc scars was enhanced by 105%, and the mass failure with the scar
Dc was reduced by 19%, but their amounts did not change significantly. In addition,
the total number and amount of mass failures corresponding to the scars Ps and Ia
were decreased by more than 50%. However, for a slope with the height of 1.0 m or
1.5 m, the probability of the Co scar occurrence was low in two-group comparisons.
Slope gradient also has an important influence on the distribution of the scar
morphologies. As shown in Fig. 11.3b, when other parameters were fixed but the
slope gradient was increased by 14% (i.e., the slope gradient was increased from
70° to 80°), the total numbers of mass failures for the six different types of scars
mentioned above were decreased, whereas their volumes were increased, with the
exception of Co and Ia scars that were reduced. This phenomenon can be attributed
to the following two reasons. First, the increased slope gradient caused the bad
infiltration on the slope face, in turn resulting in a lower frequency of mass failures
for the scars. Table 11.1 provides strong evidence that the occurrence frequency of
mass failure was decreased as the slope gradient increased. For the gully banks with
a slope of 70° (i.e., the experiments L1, 3, 5, 7 and 9), the total number of mass
failures was 182, while for those with a slope of 80° (i.e., the experiments L2, 4,
6, 8 and 10), the total number of mass failures was 116. Second, the slope stability
decreased with the rise of slope gradient. As shown in Table 11.2, in the experiments
group with the slope of 70° (i.e., the experiments L1, 3, 5, 7 and 9), the total amount
of all peak individual mass failures was 606.22 × 10
3 cm
3 . Nevertheless, the total
volume of all peak events for the experiments L2, 4, 6, 8 and 10 (with the slope of
80°) was 914.95 × 10
3 cm
3 . That is to say, the total peak volume of the individual
mass failures was augmented by 51% as the initial slope increased from 70° to 80°.
In addition, during rainfall as the soil moisture content rose, ultimately leading to
Table 11.2 The maximum volume of the individual failure masses with different scar patterns in
the experiments
Test number
Maximum volume of individual failure events (10 3 cm 3 )
Tf
Uc
Dc
Co
Ps
Ia
L1(S30-1-70d)
–
41.13
–
–
–
–
L2(S30-1-80d)
168.41
–
–
–
–
–
L3(S30-1.5-70d)
–
97.16
–
–
–
–
L4(S30-1.5-80d)
369.91
–
–
–
–
–
L5(G60-1-70d)
177.6
–
–
–
–
–
L6(G60-1-80d)
–
117.7
–
–
–
–
L7(G60-1.5-70d)
224.06
–
–
–
–
–
L8(G60-1.5-80d)
183.71
–
–
–
–
–
L9(G30-1-70d)
66.27
–
–
–
–
–
L10(G30-1-80d)
–
–
75.22
–
–
–
Total
1189.96
255.99
75.22
–
–
–
Percentage (%)
78
17
5
–
–
–