

126
8 Sediment-Storage Effects of Check-Dam …
0
2
4
6
8
1
6
11
16
Elevation , HE
m (cm)
Runoff , N m
0
2
4
6
6
7
8
9
1 0
Elevation , HE
m /(cm)
Rainfall , N m
(a)
(b)
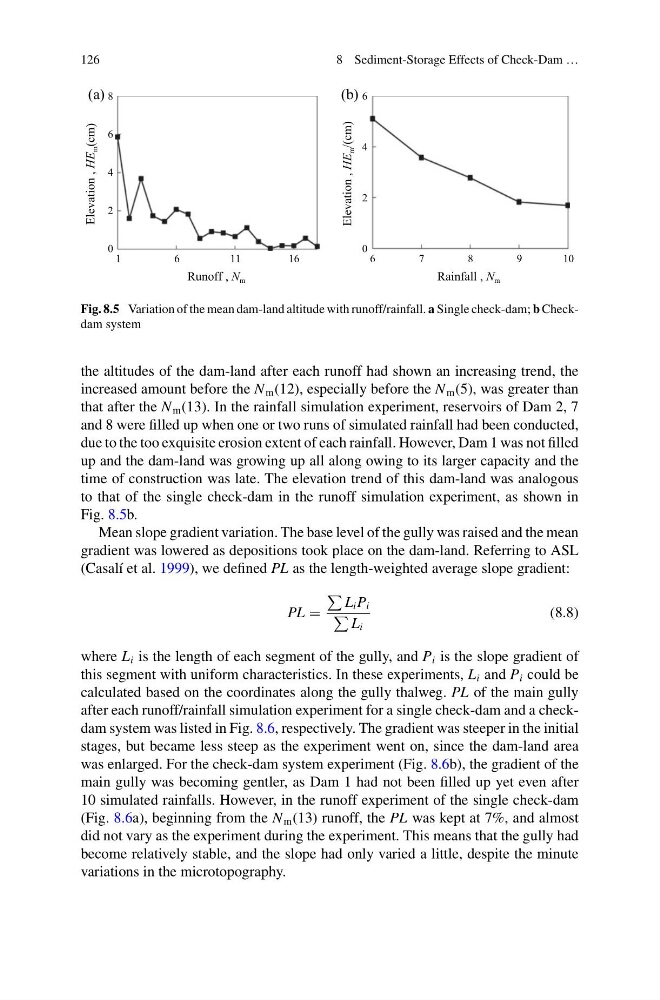
Fig. 8.5 Variation of the mean dam-land altitude with runoff/rainfall. a Single check-dam; b Checkdam system
the altitudes of the dam-land after each runoff had shown an increasing trend, the
increased amount before the N m (12), especially before the N m (5), was greater than
that after the N m (13). In the rainfall simulation experiment, reservoirs of Dam 2, 7
and 8 were filled up when one or two runs of simulated rainfall had been conducted,
due to the too exquisite erosion extent of each rainfall. However, Dam 1 was not filled
up and the dam-land was growing up all along owing to its larger capacity and the
time of construction was late. The elevation trend of this dam-land was analogous
to that of the single check-dam in the runoff simulation experiment, as shown in
Fig. 8.5b.
Mean slope gradient variation. The base level of the gully was raised and the mean
gradient was lowered as depositions took place on the dam-land. Referring to ASL
(Casalí et al. 1999), we defined PL as the length-weighted average slope gradient:
PL =
L i P i
L i
(8.8)
where L i is the length of each segment of the gully, and P i is the slope gradient of
this segment with uniform characteristics. In these experiments, L i and P i could be
calculated based on the coordinates along the gully thalweg. PL of the main gully
after each runoff/rainfall simulation experiment for a single check-dam and a checkdam system was listed in Fig. 8.6, respectively. The gradient was steeper in the initial
stages, but became less steep as the experiment went on, since the dam-land area
was enlarged. For the check-dam system experiment (Fig. 8.6b), the gradient of the
main gully was becoming gentler, as Dam 1 had not been filled up yet even after
10 simulated rainfalls. However, in the runoff experiment of the single check-dam
(Fig. 8.6a), beginning from the N m (13) runoff, the PL was kept at 7%, and almost
did not vary as the experiment during the experiment. This means that the gully had
become relatively stable, and the slope had only varied a little, despite the minute
variations in the microtopography.
8 Sediment-Storage Effects of Check-Dam …
0
2
4
6
8
1
6
11
16
Elevation , HE
m (cm)
Runoff , N m
0
2
4
6
6
7
8
9
1 0
Elevation , HE
m /(cm)
Rainfall , N m
(a)
(b)
Fig. 8.5 Variation of the mean dam-land altitude with runoff/rainfall. a Single check-dam; b Checkdam system
the altitudes of the dam-land after each runoff had shown an increasing trend, the
increased amount before the N m (12), especially before the N m (5), was greater than
that after the N m (13). In the rainfall simulation experiment, reservoirs of Dam 2, 7
and 8 were filled up when one or two runs of simulated rainfall had been conducted,
due to the too exquisite erosion extent of each rainfall. However, Dam 1 was not filled
up and the dam-land was growing up all along owing to its larger capacity and the
time of construction was late. The elevation trend of this dam-land was analogous
to that of the single check-dam in the runoff simulation experiment, as shown in
Fig. 8.5b.
Mean slope gradient variation. The base level of the gully was raised and the mean
gradient was lowered as depositions took place on the dam-land. Referring to ASL
(Casalí et al. 1999), we defined PL as the length-weighted average slope gradient:
PL =
L i P i
L i
(8.8)
where L i is the length of each segment of the gully, and P i is the slope gradient of
this segment with uniform characteristics. In these experiments, L i and P i could be
calculated based on the coordinates along the gully thalweg. PL of the main gully
after each runoff/rainfall simulation experiment for a single check-dam and a checkdam system was listed in Fig. 8.6, respectively. The gradient was steeper in the initial
stages, but became less steep as the experiment went on, since the dam-land area
was enlarged. For the check-dam system experiment (Fig. 8.6b), the gradient of the
main gully was becoming gentler, as Dam 1 had not been filled up yet even after
10 simulated rainfalls. However, in the runoff experiment of the single check-dam
(Fig. 8.6a), beginning from the N m (13) runoff, the PL was kept at 7%, and almost
did not vary as the experiment during the experiment. This means that the gully had
become relatively stable, and the slope had only varied a little, despite the minute
variations in the microtopography.