

8.3 Experimental Methods
125
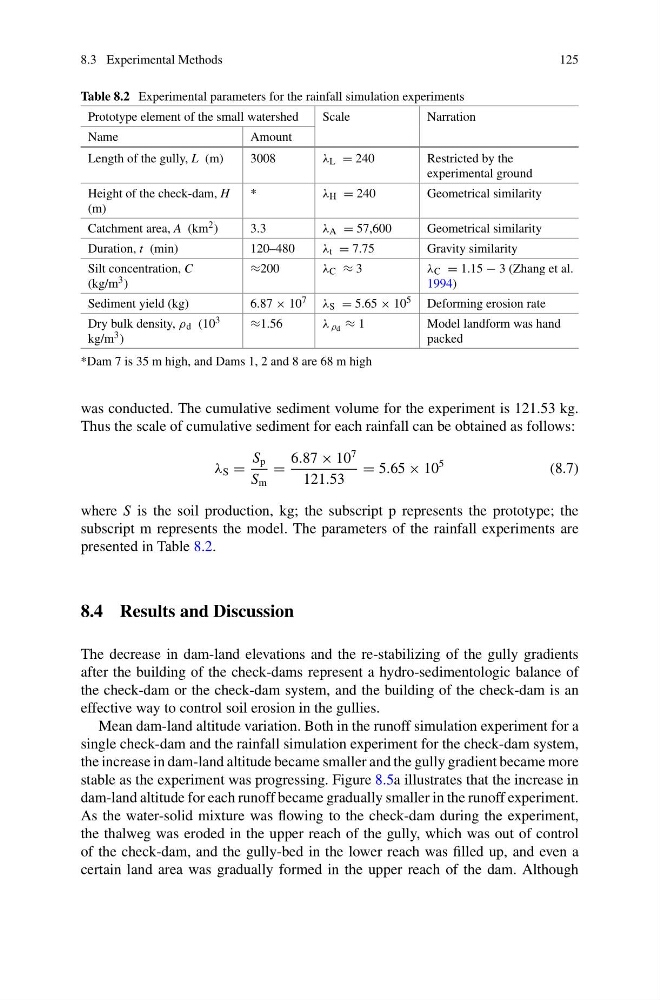
Table 8.2 Experimental parameters for the rainfall simulation experiments
Prototype element of the small watershed
Scale
Narration
Name
Amount
Length of the gully, L (m)
3008
λ L = 240
Restricted by the
experimental ground
Height of the check-dam, H
(m)
*
λ H = 240
Geometrical similarity
Catchment area, A (km 2 )
3.3
λ A = 57,600
Geometrical similarity
Duration, t (min)
120–480
λ t = 7.75
Gravity similarity
Silt concentration, C
(kg/m 3 )
≈200
λ C ≈ 3
λ C = 1.15 − 3 (Zhang et al.
1994)
Sediment yield (kg)
6.87 × 10 7 λ S = 5.65 × 10 5 Deforming erosion rate
Dry bulk density, ρ d (10 3
kg/m 3 )
≈1.56
λ ρd ≈ 1
Model landform was hand
packed
*Dam 7 is 35 m high, and Dams 1, 2 and 8 are 68 m high
was conducted. The cumulative sediment volume for the experiment is 121.53 kg.
Thus the scale of cumulative sediment for each rainfall can be obtained as follows:
λ S =
S p
S m
=
6.87 × 10
7
121.53
= 5.65 × 10
5
(8.7)
where S is the soil production, kg; the subscript p represents the prototype; the
subscript m represents the model. The parameters of the rainfall experiments are
presented in Table 8.2.
8.4 Results and Discussion
The decrease in dam-land elevations and the re-stabilizing of the gully gradients
after the building of the check-dams represent a hydro-sedimentologic balance of
the check-dam or the check-dam system, and the building of the check-dam is an
effective way to control soil erosion in the gullies.
Mean dam-land altitude variation. Both in the runoff simulation experiment for a
single check-dam and the rainfall simulation experiment for the check-dam system,
the increase in dam-land altitude became smaller and the gully gradient became more
stable as the experiment was progressing. Figure 8.5a illustrates that the increase in
dam-land altitude for each runoff became gradually smaller in the runoff experiment.
As the water-solid mixture was flowing to the check-dam during the experiment,
the thalweg was eroded in the upper reach of the gully, which was out of control
of the check-dam, and the gully-bed in the lower reach was filled up, and even a
certain land area was gradually formed in the upper reach of the dam. Although
125
Table 8.2 Experimental parameters for the rainfall simulation experiments
Prototype element of the small watershed
Scale
Narration
Name
Amount
Length of the gully, L (m)
3008
λ L = 240
Restricted by the
experimental ground
Height of the check-dam, H
(m)
*
λ H = 240
Geometrical similarity
Catchment area, A (km 2 )
3.3
λ A = 57,600
Geometrical similarity
Duration, t (min)
120–480
λ t = 7.75
Gravity similarity
Silt concentration, C
(kg/m 3 )
≈200
λ C ≈ 3
λ C = 1.15 − 3 (Zhang et al.
1994)
Sediment yield (kg)
6.87 × 10 7 λ S = 5.65 × 10 5 Deforming erosion rate
Dry bulk density, ρ d (10 3
kg/m 3 )
≈1.56
λ ρd ≈ 1
Model landform was hand
packed
*Dam 7 is 35 m high, and Dams 1, 2 and 8 are 68 m high
was conducted. The cumulative sediment volume for the experiment is 121.53 kg.
Thus the scale of cumulative sediment for each rainfall can be obtained as follows:
λ S =
S p
S m
=
6.87 × 10
7
121.53
= 5.65 × 10
5
(8.7)
where S is the soil production, kg; the subscript p represents the prototype; the
subscript m represents the model. The parameters of the rainfall experiments are
presented in Table 8.2.
8.4 Results and Discussion
The decrease in dam-land elevations and the re-stabilizing of the gully gradients
after the building of the check-dams represent a hydro-sedimentologic balance of
the check-dam or the check-dam system, and the building of the check-dam is an
effective way to control soil erosion in the gullies.
Mean dam-land altitude variation. Both in the runoff simulation experiment for a
single check-dam and the rainfall simulation experiment for the check-dam system,
the increase in dam-land altitude became smaller and the gully gradient became more
stable as the experiment was progressing. Figure 8.5a illustrates that the increase in
dam-land altitude for each runoff became gradually smaller in the runoff experiment.
As the water-solid mixture was flowing to the check-dam during the experiment,
the thalweg was eroded in the upper reach of the gully, which was out of control
of the check-dam, and the gully-bed in the lower reach was filled up, and even a
certain land area was gradually formed in the upper reach of the dam. Although