

88
6 A Close Look of the Gravity Erosion …
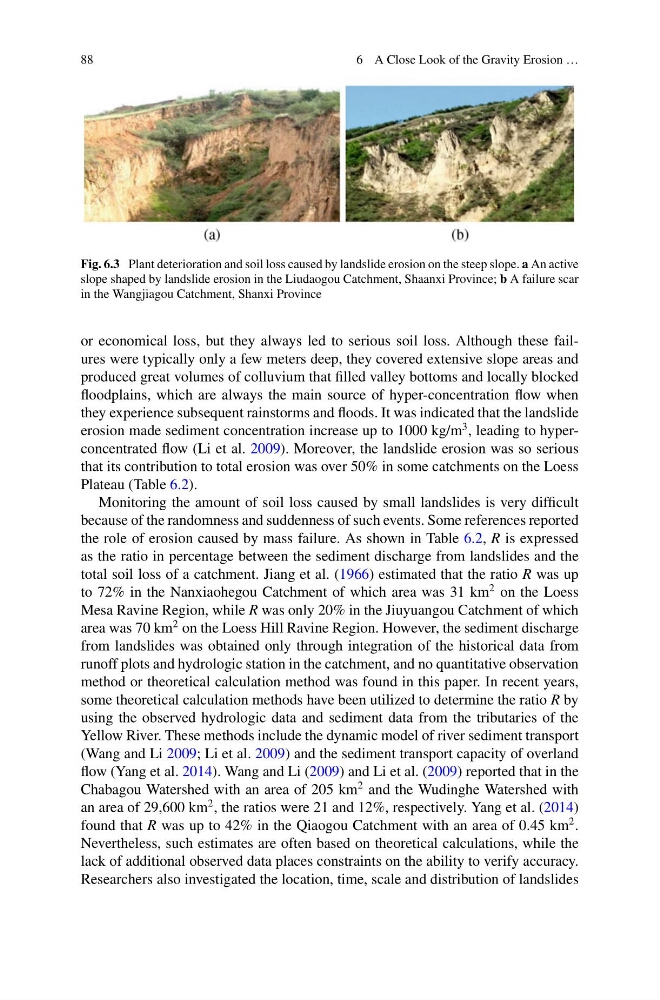
Fig. 6.3 Plant deterioration and soil loss caused by landslide erosion on the steep slope. a An active
slope shaped by landslide erosion in the Liudaogou Catchment, Shaanxi Province; b A failure scar
in the Wangjiagou Catchment, Shanxi Province
or economical loss, but they always led to serious soil loss. Although these failures were typically only a few meters deep, they covered extensive slope areas and
produced great volumes of colluvium that filled valley bottoms and locally blocked
floodplains, which are always the main source of hyper-concentration flow when
they experience subsequent rainstorms and floods. It was indicated that the landslide
erosion made sediment concentration increase up to 1000 kg/m
3 , leading to hyperconcentrated flow (Li et al. 2009). Moreover, the landslide erosion was so serious
that its contribution to total erosion was over 50% in some catchments on the Loess
Plateau (Table 6.2).
Monitoring the amount of soil loss caused by small landslides is very difficult
because of the randomness and suddenness of such events. Some references reported
the role of erosion caused by mass failure. As shown in Table 6.2, R is expressed
as the ratio in percentage between the sediment discharge from landslides and the
total soil loss of a catchment. Jiang et al. (1966) estimated that the ratio R was up
to 72% in the Nanxiaohegou Catchment of which area was 31 km
2 on the Loess
Mesa Ravine Region, while R was only 20% in the Jiuyuangou Catchment of which
area was 70 km
2 on the Loess Hill Ravine Region. However, the sediment discharge
from landslides was obtained only through integration of the historical data from
runoff plots and hydrologic station in the catchment, and no quantitative observation
method or theoretical calculation method was found in this paper. In recent years,
some theoretical calculation methods have been utilized to determine the ratio R by
using the observed hydrologic data and sediment data from the tributaries of the
Yellow River. These methods include the dynamic model of river sediment transport
(Wang and Li 2009; Li et al. 2009) and the sediment transport capacity of overland
flow (Yang et al. 2014). Wang and Li (2009) and Li et al. (2009) reported that in the
Chabagou Watershed with an area of 205 km
2 and the Wudinghe Watershed with
an area of 29,600 km
2 , the ratios were 21 and 12%, respectively. Yang et al. (2014)
found that R was up to 42% in the Qiaogou Catchment with an area of 0.45 km
2 .
Nevertheless, such estimates are often based on theoretical calculations, while the
lack of additional observed data places constraints on the ability to verify accuracy.
Researchers also investigated the location, time, scale and distribution of landslides
6 A Close Look of the Gravity Erosion …
Fig. 6.3 Plant deterioration and soil loss caused by landslide erosion on the steep slope. a An active
slope shaped by landslide erosion in the Liudaogou Catchment, Shaanxi Province; b A failure scar
in the Wangjiagou Catchment, Shanxi Province
or economical loss, but they always led to serious soil loss. Although these failures were typically only a few meters deep, they covered extensive slope areas and
produced great volumes of colluvium that filled valley bottoms and locally blocked
floodplains, which are always the main source of hyper-concentration flow when
they experience subsequent rainstorms and floods. It was indicated that the landslide
erosion made sediment concentration increase up to 1000 kg/m
3 , leading to hyperconcentrated flow (Li et al. 2009). Moreover, the landslide erosion was so serious
that its contribution to total erosion was over 50% in some catchments on the Loess
Plateau (Table 6.2).
Monitoring the amount of soil loss caused by small landslides is very difficult
because of the randomness and suddenness of such events. Some references reported
the role of erosion caused by mass failure. As shown in Table 6.2, R is expressed
as the ratio in percentage between the sediment discharge from landslides and the
total soil loss of a catchment. Jiang et al. (1966) estimated that the ratio R was up
to 72% in the Nanxiaohegou Catchment of which area was 31 km
2 on the Loess
Mesa Ravine Region, while R was only 20% in the Jiuyuangou Catchment of which
area was 70 km
2 on the Loess Hill Ravine Region. However, the sediment discharge
from landslides was obtained only through integration of the historical data from
runoff plots and hydrologic station in the catchment, and no quantitative observation
method or theoretical calculation method was found in this paper. In recent years,
some theoretical calculation methods have been utilized to determine the ratio R by
using the observed hydrologic data and sediment data from the tributaries of the
Yellow River. These methods include the dynamic model of river sediment transport
(Wang and Li 2009; Li et al. 2009) and the sediment transport capacity of overland
flow (Yang et al. 2014). Wang and Li (2009) and Li et al. (2009) reported that in the
Chabagou Watershed with an area of 205 km
2 and the Wudinghe Watershed with
an area of 29,600 km
2 , the ratios were 21 and 12%, respectively. Yang et al. (2014)
found that R was up to 42% in the Qiaogou Catchment with an area of 0.45 km
2 .
Nevertheless, such estimates are often based on theoretical calculations, while the
lack of additional observed data places constraints on the ability to verify accuracy.
Researchers also investigated the location, time, scale and distribution of landslides